Biomedical Engineering Reference
In-Depth Information
This model for p
0
(c;q;) increases in both c and q; with p
0
(c; 0;) = 0 reecting the
fact that the clot cannot dissolve instantaneously at s = 0 without a bolus infusion
of some tPA (q > 0). Figure 12.1 illustrates possible forms of p
0
(c;q;):
FIGURE 12.1: Illustration of possible shapes of p
0
(c;q) considered as a
function of c with fixed q = 0.2.
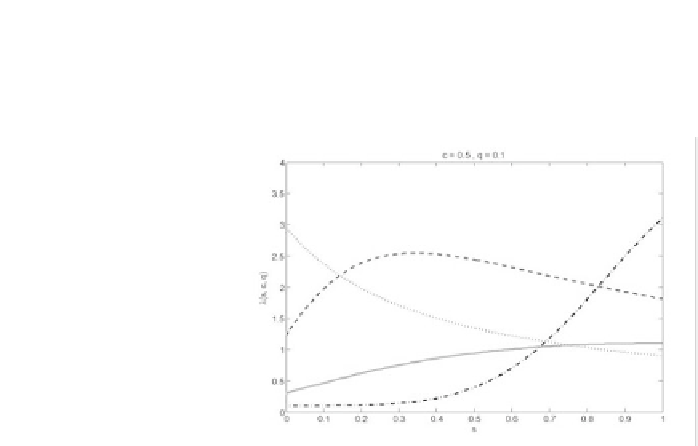
The smooth hazard function is
(s;c;q;) =
3
+
4
5
fd(s;c
1
;q
2
)g
5
1
1 +
4
fd(s;c
1
;q
2
)g
5
for s > 0;
(12.4)
where all
j
> 0;
3
is the baseline hazard of the clot dissolving if no tPA is given,
and d(s;c
1
;q
2
) = c
1
fq
2
+ (1 q
2
)sg is the eective cumulative delivered dose
by standardized time s. Thus, = (
0
; ;
5
) characterizes p
0
and : Figure 12.2
illustrates possible shapes of (s;c;q;) as a function of s:
In Equations (12:3) and (12:4); c
1
and q
2
are used as arguments rather than c
and q to allow p
0
and to vary nonlinearly in both c and q: The cumulative hazard
function is
"
1 +
4
fd(s;c
1
;q
2
)g
5
1 +
4
(c
1
q
2
)
5
#
1
c
1
(1 q
2
)
log
(s;c;q;) =
3
s +
for s > 0:
(12.5)
We dene
T
(Y
E
;c;q;) = Pr(Y
T
= 1 jY
E
;c;q;) conditional on Y
E
because the
risk of toxicity may be affected by Y
E
. The model accounts for the possibilities that
either larger Y
E
; hence a larger amount of the continuously infused agent, or failure
to dissolve the clot may increase the probability of SICH. Denoting the minimum of


Search WWH ::

Custom Search