Biomedical Engineering Reference
In-Depth Information
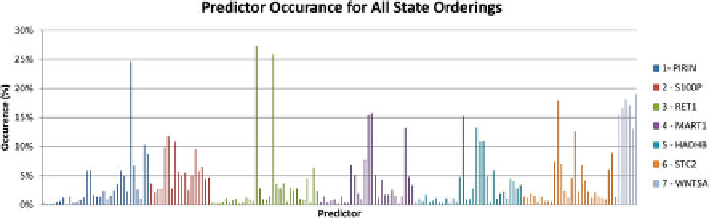
Fig. 2.4
Method A: Predictor occurrence for all valid attractor cycle orderings (first iteration: no
predictor selected)
2.5.1
Method A
In
method A
, a predictor histogram is created as in Fig.
2.4
. From the histogram, for
each gene
g
i
, we find its predictor
p
j
such that
p
j
is the most frequently occurring
predictor of gene
g
i
and the
resolution ratio R
i
of this predictor (defined as the ratio
of the occurrence frequency of
p
j
to the occurrence frequency of the next most
frequently occurring predictor of gene
g
i
) is maximum. Among all genes, we choose
the one with the highest resolution ratio, and select its most frequently occurring
predictor as its final predictor. After selecting this final predictor, we regenerate
the histogram, discarding any candidate predictor sets that do not contain the final
predictor(s) that have been selected in previous steps. The process repeats until all
genes have a single final predictor. The set of final predictors of all genes forms the
predictor set. The advantage of method A is that at every iteration, we select real
predictors that have a high overall occurrence in the solution. However the method
may have problems selecting final predictors if the resolution ratio is low (i.e. when
the frequencies of occurrence of the predictors are nearly identical).
2.5.2
Method B
As an alternative,
method B
is proposed, to determine for each gene
i
, how likely it
is that gene
g
i
will predict the other genes in the GRN. In other words, we ask what
is the occurrence frequency of
x
i
in the predictors of
f
j
. Table
2.3
shows in entry
(
i
,
j
) how frequently a gene
g
i
is used to predict a gene
g
j
. This table is populated by
summing the occurrence frequency of all predictors of
g
j
that have gene
g
i
as one of
their inputs. As such, any entry can be
1, and is a measure of the usefulness of
g
i
as a predictor for
g
j
. The predictor of
g
j
is determined by finding, for each column
j
of Table
2.3
, the three largest entries and adding their values. Suppose we call
this sum
s
j
(the resolution score of column
j
). We compute the resolution score for
all columns and select the final predictor for the column with the highest resolution
≥