Biomedical Engineering Reference
In-Depth Information
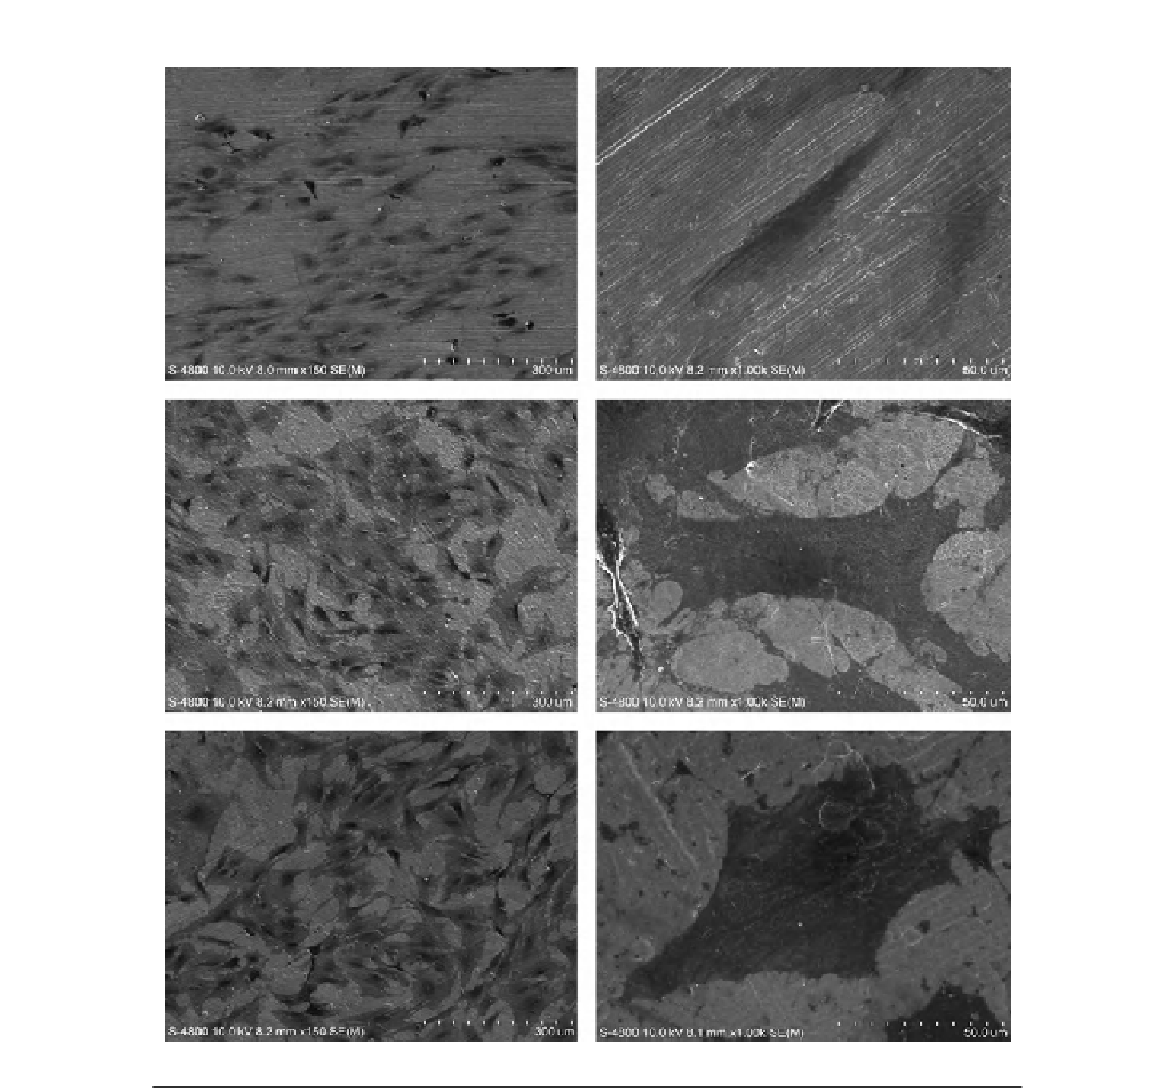
(A)
(B)
(C)
(D)
(E)
(F)
FIGURE 17.8
SEM pictures showing the morphology of cells after 2 days of culture on samples. (A and B) flat Ti control;
(C and D) 25 nm NTs; (E and F) 80 nm NTs.
Reprinted with permission from Ref.
[2]
.