Biomedical Engineering Reference
In-Depth Information
(A)
(B)
(C)
(D)
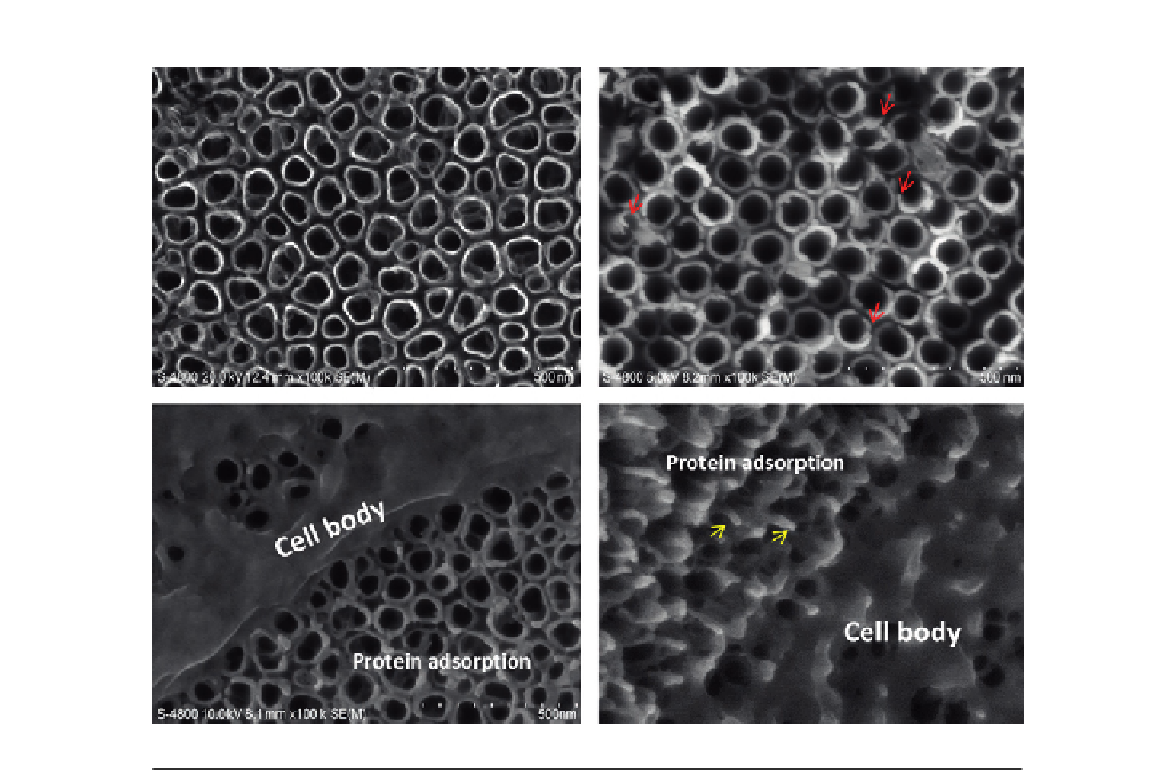
FIGURE 17.5
(A) NTs formed at 20 V in 0.5 wt% HF aqueous solution; (B) NTs formed at 40 V in an EG solution with 0.5 wt
%NH
4
F, 5 vol% CH
3
OH, and 5 vol% H
2
O. Red arrows indicate the unsmooth top ends of nanotube walls
with flakes; (C) protein adsorption on the NTs shown in (A) and the detail of cell interaction with them;
(D) protein adsorption on the NTs shown in (B) and details of cell interaction with them. Yellow arrows show
the protein pillars formed on them. (For interpretation of the references to color in this figure legend, the
reader is referred to the web version of this topic.)
Parts of the figure are reprinted with permission from Ref.
[2]
.
(
Figure 17.5A
), and consequently induce an even distribution of proteins along the tube walls and
intimate cell attachment (
Figure 17.5C
). On contrary, for the NTs formed in an EG solution with
0.5 wt% NH
4
F, 5 vol% CH
3
OH, and 5 vol% H
2
O, the top ends of the NT walls are not completely
smooth and have flakes (
Figure 17.5B
). Although the NTs formed in the EG solution induce more
protein deposition forming thicker protein layers, the adsorbed proteins do not distribute evenly but
form pillars (
Figure 17.5D
). Tall protein pillars with relatively small
top dimensions mostly
50 nm are distributed at a certain distance from each other. The uneven protein distribution can
be ascribed to the unsmooth top ends of the NT walls with flakes, which provide local nucleation
,