Biomedical Engineering Reference
In-Depth Information
120
100
Control
0.1%
0.5%
1.0%
2.0%
80
*
*
60
*
*
40
*
*
25%
*
*
20
0
0
2
8
24
72
Incubation period (h)
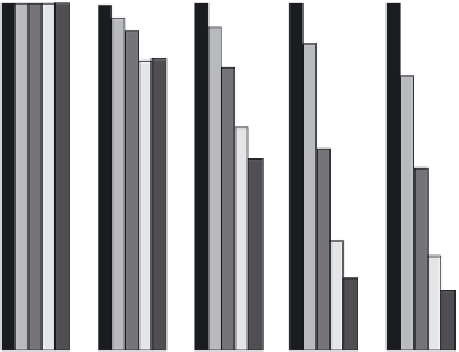
FIGURE 14.5
Cell viabilities (%) for tissue conditioner with varying concentrations in the range of 0
2.0% of Ag
at 2
72 h
of incubation. * represents values statistically different from control (
0.01).
P,
1.0
0.9
0.8
0.7
0.6
(C)
0.5
0.4
0.3
(B)
0.2
(A)
0.1
0.0
24
36
48
60
72
Time (h)
FIGURE 14.6