Biomedical Engineering Reference
In-Depth Information
(A)
(D)
(G)
(B)
(E)
(H)
(C)
(F)
(I)
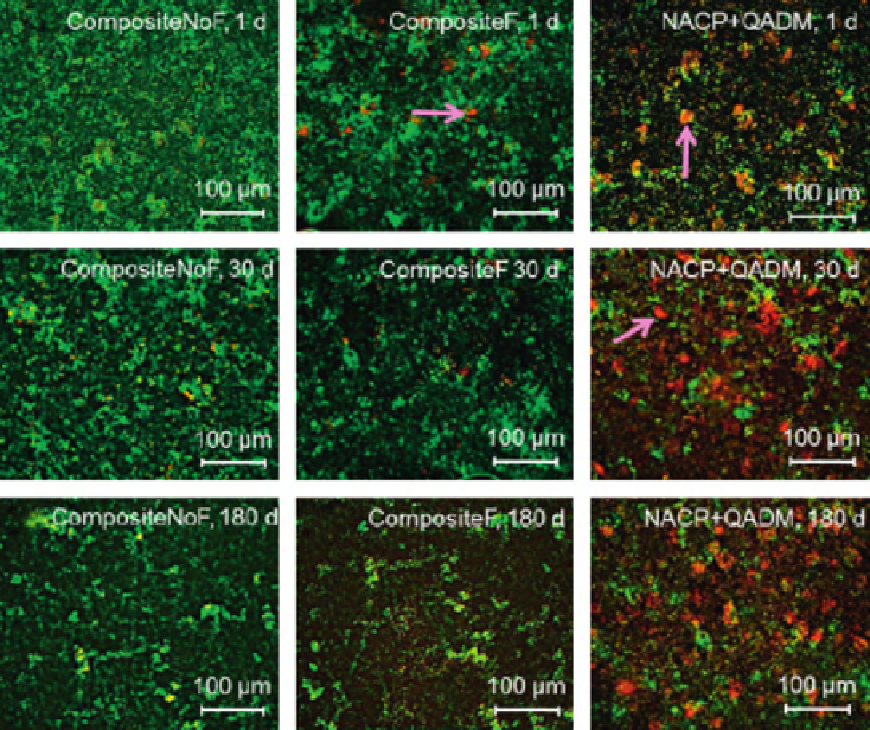
FIGURE 6.4
Live/dead staining of 3-days biofilms on composites. Live bacteria were stained green and dead bacteria were stained
red. Live and dead bacteria in close proximity showed yellow/orange colors. The images shown in (A
I) are
representative of each group. CompositeNoF was covered by a dense biofilm with green staining. CompositeF had
some compromised bacteria. NACP
QADM had much more dead bacteria staining than the controls. The area
fraction of live bacteria staining is plotted (mean
1
6
sd;
n
5
6). There was little difference in biofilm viability versus aging
time, indicating that the antibacterial activity of NACP
QADM nanocomposite was not lost in water immersion. (For
interpretation of the references to color in this figure legend, the reader is referred to the web version of this topic.)
Adapted from Ref.
[52]
with permission.
and compromised bacteria were closely associated, and the red color was mingled with green to yield
yellow/orange colors. Examples of these staining colors are indicated by the arrows. Compared to
CompositeNoF and CompositeF, NACP
1
QADM had much more red/yellow/orange staining.
Representative scanning electron microscopy (SEM) images of the biofilm structures on compo-
sites surfaces are shown in
Figure 6.5
. In (A) and (B), the CompositeNoF and CompositeF had