Biomedical Engineering Reference
In-Depth Information
fungus
S. nodorum
, it became respectively: the strain Bas1 - 67.0%, 9MN -
68.5%, while the strains 6VD - 73.0% and 4 VD - 80.7%.
Figure 4.
shows the results of PCR—amplification of DNA from
mycelium of pathogenic fungi
T. caries
,
U. tritici
,
F. culmorum
,
B. sorokiniana
,
S. tritici
,
B. bassiana
using two primers: the fi rst to the
ITS
and the second
primer is highly specifi c to the
CDA
gene the pathogen
S. nodorum
. As it
can be seen, amplifi cation with primers to the
CDA
gene occurred only with
DNA extracted from mycelium of
S. nodorum
and the size of the amplicon
match the theoretically calculated level for this site of the gene - 387 bp
(Figure 4, track 7). In the infected tissues of wheat,
CDA
gene was detected
within 24 hours after inoculation (Figure 4, track 8). At the same time when
using DNA from uninfected wheat leaves as template, formation of this
amplicon did not occur (Figure 4, track 9). The absence of amplicons in the
tracks 1-6 and 9 confi rms specifi city of the primers only for the
CDA
gene
of the fungus
S. nodorum
.
It is important to note that the primers for
ITS
allowed us to discuss
the purity of DNA extraction and PCR analysis for DNA diagnosis on the
presence of the pathogen
S. nodorum
in the wheat plants. Moreover, in
contrast to the
ITS
primers, used in the work of J.J. Beck and J.M. Ligon
(1995) which were highly specifi c, or for
S. nodorum
, or for
S. tritici
, our
ITS
primers formed amplicons with DNA from other fungi species
(Figure 4).
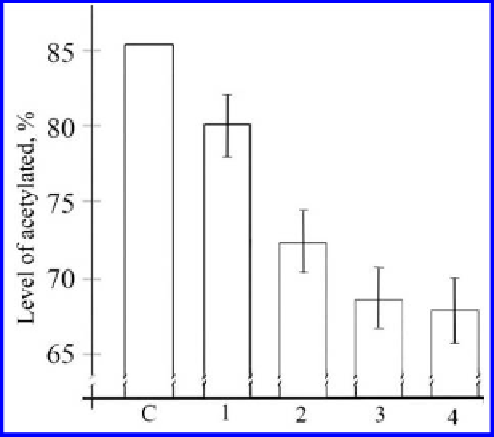
Figure 3.
Infl uence of cultural medium of
S. nodorum
strains were cultivating 20 days in
Czapek liquid medium on chitin acetylated degree: C- Control chitin; 1- 4VD; 2 - 6VD;
3 - 9MN; 4- Bas1. The signifi cance of differences between strains
was determined with a
t-test and indicates a difference signifi cant at the P<0.01 level
.