Biomedical Engineering Reference
In-Depth Information
made of tetramer (spot I), trimer (spot II), and dimer (spot III).
Although SEM revealed other regions that are labeled by NPs, these
monomeric particles do not support strong SERS signals and thus
were not detected. SERS spectra taken from spot III also revealed a
much weaker nitrile vibration compared to the other two. As spot
III is made up of a coupled rod-sphere structure, it is quite possible
that the surface plasmon resonance of the coupled structure shifted
to the red and could no longer be excited effectively at the excitation
wavelength (632.8 nm) used in this study. Of note, it is important to
point out that because the NPs were not deliberately induced into
aggregation in this type of labeling study, the observation of SERS
signals will entirely rely on the receptor-mediated aggregation.
Membrane proteins often cluster onto micro-domains called rafts,
which help facilitate aggregation of NPs upon labeling thus producing
strong SERS signals.
(A)
(B)
(C)
μ
μ
m
(
)
(
)
μ
(
)
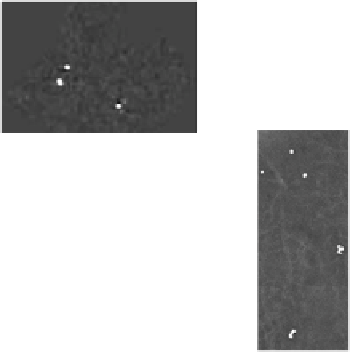
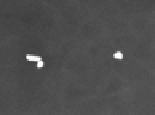
Figure 11.9
(A) Optical image of a HeLa cell co-labeled with Raman-
reporter and target-speciic molecules. (B) SERS intensity
map of the nitrile vibrational band with three SERS hot
spots I, II, and III identiied. (C) and (D) SEM image of the
corresponding area showed SERS activity. (E) SERS spectra
of the three spots identiied in the intensity map. Inset of
(E) shows the cell Raman spectrum taken from the nucleus
region labeled as spot IV.
68
See also Color Insert.


Search WWH ::

Custom Search