Biomedical Engineering Reference
In-Depth Information
Figure 9.5
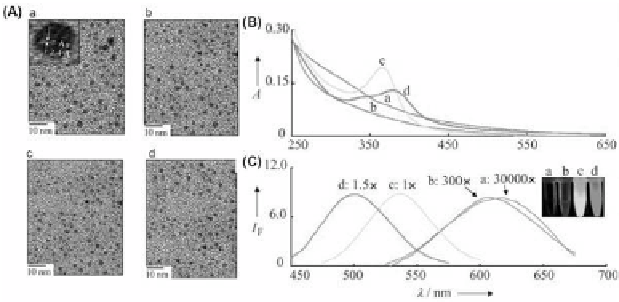
(A) TEM images, (B) UV-Vis absorbance spectra, and (C)
normalized luminescence spectra of (a) Au NPs, (b) 2-ME-
Au NPs, (c) 6-MH-Au NPs, and (d) 11-MU-Au NPs. Inset to
(C): Photograph of the luorescence of the various Au NPs
upon excitation under a hand-held UV lamp (365 nm). The
normalized luminescence intensities (
I
F
) are plotted in
arbitrary units (a.u.); excitation wavelength: 365 nm. In (C),
the concentration ratio of the Au NPs, 2-ME-Au NPs, 6-MH-Au
NPs, and 11-MU-Au NPs was 3000:300:1:1.5. Reprinted with
permission from Ref. 24. See also Color Insert.
Figure 9.5A displays TEM images of uncapped Au NPs and Au
NPs capped with 2-mercaptoethanol (2-ME), 6-mercaptohexanol
(6-MH), and 11-mercaptoundecanol (11-MU); these as-prepared
alkanethiol-capped Au NPs, denoted as 2-ME-Au NPs, 6-MH-Au
NPs, and 11-MU-Au NPs, respectively, have average diameters of 2.9
(±0.5), 2.3 (±0.3), 2.2 (±0.2), and 2.0 (±0.2) nm, respectively.
24
The
smallest diameter, for the 11-MU-Au NPs, is due to greater degrees
of breaking and detaching of larger-sized Au NCs and/or Au-thiol
complexes. Figure 9.5B,C display the absorption and normalized
luminescence spectra of the as-prepared Au NP, 2-ME-Au NP,
6-MH-Au NP, and 11-MU-Au NP solutions. The as-prepared Au NPs
(2.9 nm) exhibit no apparent absorption band, revealing that the Au
NPs prepared by THPC did not contain Au(I) atoms on the surface
of each Au NP. Similarly, there is no apparent absorption band for
the 2-ME-Au NPs. In contrast, the 6-MH- and 11-MU-Au NPs exhibit
absorption band maxima at wavelengths (
λ
max
abs
) of 367 and 383 nm,
respectively. The luminescence wavelength underwent a blue shift
upon increasing the chain length of the thiol, primarily because of


Search WWH ::

Custom Search