Biomedical Engineering Reference
In-Depth Information
the RLS signals decrease, showing that the aggregations of Au NPs
are indeed eficient at light scattering at a wavelength near the LSPR
band of the Au NPs. By plotting the ratio of scattered light intensities
at two different wavelengths, 560 and 680 nm, against glucose
concentration, glucose concentrations can be readily determined
from a few mM up to ~60 mM using a simple white light emitting
diode and detection system. This simple and low-cost approach is
ideal for monitoring physiological blood glucose where red scattering
wavelengths (>600 nm) can be selected to eliminate the absorption
of hemoglobin, water, and melanin.
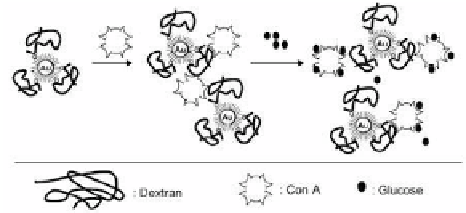
Figure 8.3
Glucose sensing scheme based on the dissociation of dextran-
coated Au-NPs/concanavalin A aggregates and their respective
light scattering properties. Reprinted from Ref. 33 with
permission.
Figure 8.4
(A) RLS spectra of 3.0 × 10
-10
M Au-NP seeds, upon growth in
the presence of 2.4 × 10
-4
M HAuCl
4
and 2.4 × 10
-3
M CTAC
in 0.01 M PBS (pH 7.0), with different concentrations of H
2
O
2
:
(a) 0; (b) 2.5 × 10
-6
M; (c) 2.2 × 10
-5
M; (d) 5.0 × 10
-6
M;
(e) 9.4 × 10
-5
M; (f) 1.8 × 10
-4
M; and (g) 2.6 × 10
-4
M. All
spectra were recorded after a reaction time of 15 min. (B)
The calibration curve corresponding to the RLS intensity at
375 nm vs. the concentration of H
2
O
2
in the growth solution.
The inset is the linear plots in the range of 5.0 × 10
-7
M to
9.5 × 10
-5
M. Reprinted from Ref. 35 with permission.


Search WWH ::

Custom Search