Biomedical Engineering Reference
In-Depth Information
result of the much smaller sensing volume offered by the PPR sensors
(20−40 nm),
55,56
as the electromagnetic ield decay length is about
10 times shorter than that of the SPR sensors (200−400 nm).
48
To improve the RIR of the FO-PPR sensor, the key is to lower
the noise and baseline drift of the system. Upon improvement of
the instrumentation as shown in Fig. 5.1, an optical stability (OS) of
0.0091% in terms of coeficient of variation (CV) was achieved. The
OS is calculated by
e
=×
(5.24)
OS
100%
R
where
e
is the root-mean-square noise of the system with a blank.
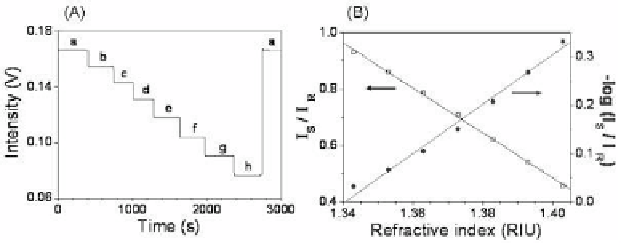
Using this system, an RIR of 1.9 × 10
−6
RIU can be achieved, as
shown in Fig. 5.2. Now, even the bulk RIR by the FO-PPR sensor is
comparable to that achieved by many SPR sensors.
48
The igure also
shows that the plot of
I
S
/
I
R
versus medium RI with a correlation
coeficient (
R
) of 0.9994 is slightly more linear than the plot of
−log(
I
S
/
I
R
) versus medium RI (
R
= 0.9934). The slopes of the plots
I
S
/
I
R
versus medium RI and −log(
I
S
/
I
R
) versus medium RI are −7.9
RIU
−1
and 5.0 absorbance unit (AU)/RIU, respectively. In a previous
study, a sensitivity of 4.2 AU/RIU has also been reported.
23
The
value of the slope is a useful indicator of the density of NMNPs on
the iber core, although the size of the NMNPs should also be taken
into consideration.
Figure 5.2
(A) Temporal response of a FO-PPR sensor with serial injection
of samples with refractive index of (a) 1.333, (b) 1.343,
(c) 1.353, (d) 1.363, (e) 1.373, (f) 1.383, (g) 1.393, and (h) 1.403.
(B) Dependency of the FO-PPR biosensor signal expressed as
I
S
/
I
R
or −log(
I
S
/
I
R
) on the refractive index of the surrounding
medium.


Search WWH ::

Custom Search