Biomedical Engineering Reference
In-Depth Information
0
20
40
60
80
100
0
20
40
60
80
100
Proportion of time
Proportion of time
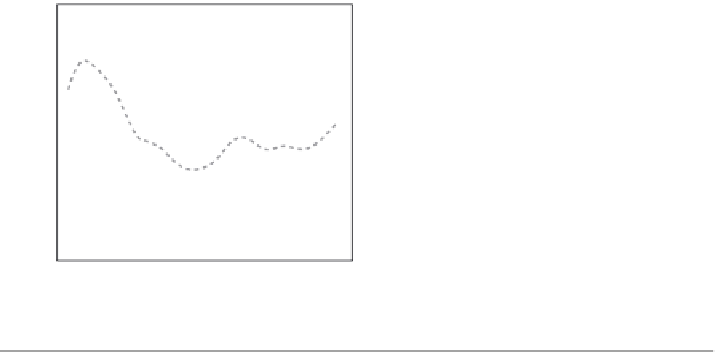
FIGURE 9.18
Ground reaction forces in the vertical direction during the box-lifting cycle (dashed gray
curve represents experimental results, and solid dark curve represents the predicted
results).
0 0 0
% Box Lifting Cycle
60
80
100
0 0 0
% Box Lifting Cycle
60
80
100
0 0 0
% Box Lifting Cycle
60
80
100
0 0 0
% Box Lifting Cycle
60
80
100
0 0 0
% Box Lifting Cycle
60
80
100
0 0 0
% Box Lifting Cycle
60
80
100
FIGURE 9.19
Interval of confidence for each critical parameter.


Search WWH ::

Custom Search