Biomedical Engineering Reference
In-Depth Information
120
100
80
60
40
20
0
-20
-40
70
60
50
40
30
20
10
0
-10
-20
-30
0 10 20 30 40 50 60 70 80 90100
0 10 20 30 40 50 60 70 80 90 100
Lifting cycle (%)
Lifting cycle (%)
40
35
30
25
20
15
10
5
0
-5
-10
-15
40
30
20
10
0
-10
-20
-30
-40
-50
-60
-70
-80
-90
-100
0 10 20 30 40 50 60 70 80 90 100
0 10 20 30 40 50 60 70 80 90100
Lifting cycle (%)
Lifting cycle (%)
0
-10
-20
-30
-40
-50
-60
-70
-80
-90
-100
-110
-120
45
40
35
30
25
20
15
10
5
0
-5
0 10 20 30 40 50 60 70 80 90 100
0 10 20 30 40 50 60 70 80 90 100
Lifting cycle (%)
Lifting cycle (%)
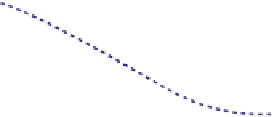
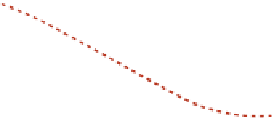
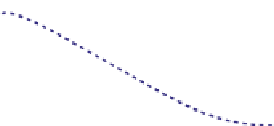
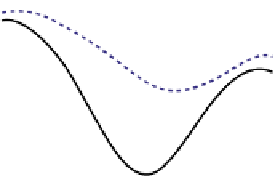
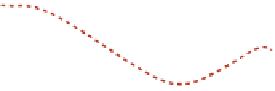
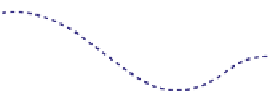
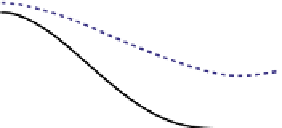
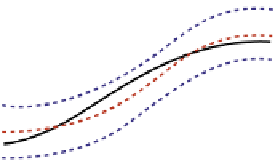
FIGURE 8.14
Comparison of lifting determinants between simulation and experiments.
In general, the predicted lifting motion has shown a good correlation with the
experimental data. First, they stay inside the normal region specified by the inter-
val of confidence (outer dashed curves). Additionally, they show similar trends to
those of
the mean (the middle dashed curve)
for
the normal
subjects.


Search WWH ::

Custom Search