Biomedical Engineering Reference
In-Depth Information
(B)
(A)
1800
1200
1600
1000
Ankle
1400
Grip
1200
800
1000
600
800
600
400
400
200
200
0
0
0.0
0.2
0.4
0.6
0.8
1.0
0.2
0.4
0.6
0.8
1.0
Standardized Intensity
Standardized Intensity
(C)
(D)
2500
1200
1000
2000
Knee
Elbow
800
1500
600
1000
400
500
200
0
0
0.0
0.2
0.4
0.6
0.8
1.0
0.0
0.2
0.4
0.6
0.8
1.0
Standardized Intensity
Standardized Intensity
(E)
(F)
1200
1200
1000
1000
Trunk
Shoulder
800
800
600
600
400
400
200
200
0
0
0.0
0.2
0.4
0.6
0.8
1.0
0.2
0.4
0.6
0.8
1.0
Standardized Intensity
Standardized Intensity
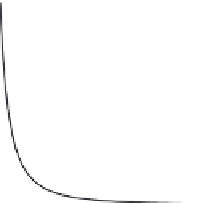
FIGURE 6.11
Joint-specific statistical fatigue models (mean
95% prediction intervals) and their
corresponding experimental data points from the literature.
Reprinted with permission from
Frey-Law and Avin, 2010
6
Monod and Scherrer, 1965; Rose et al., 2000
) based on limited fatigue data and/or a
compilation of other models. We recently performed a systematic review of the litera-
ture to gather all relevant static fatigue data (194 publications were included, with 369


Search WWH ::

Custom Search