Biomedical Engineering Reference
In-Depth Information
[ms
∧
−
1]
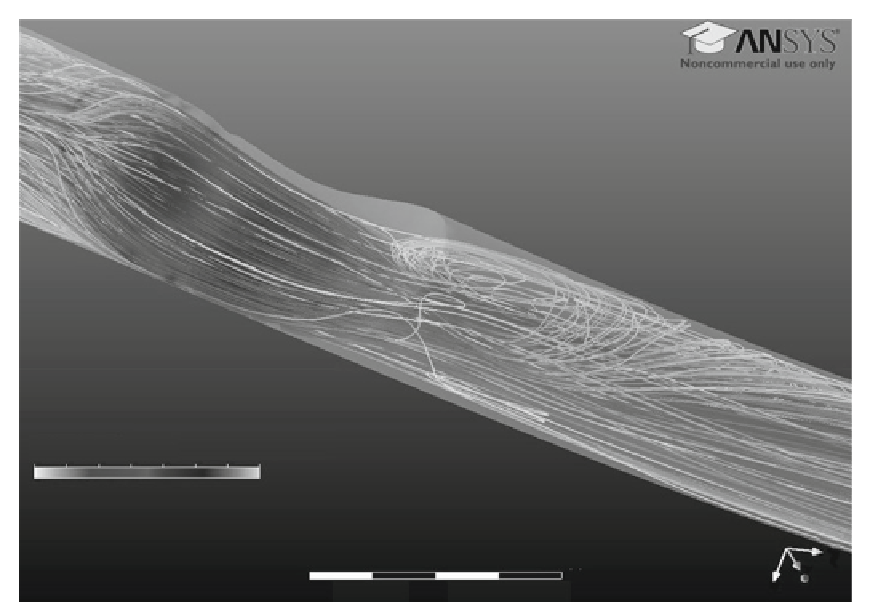
Platelet velocity
Platelet trajectory
x
0
0.003
0.006 (m)
z
y
0.0015
0.0045
FIGURE 13.7
A discrete phase model can be used to estimate platelet trajectories after they pass an 80% steno-
sis in the left descending artery. This image shows the trajectories of every particle seeded at the inlet and we can
see that a significant proportion of these become trapped in the recirculation zone downstream of the stenosis.
instantaneous velocities in the carrier phase (blood) are used to solve for the particle veloc-
ity. The instantaneous characteristics will be calculated by adding random fluctuations
obtained from the
k-ω
simulation, using the equation
r
2
k
3
u
N
5u1λ
ð
13
:
18
Þ
where
1 to 1 sampled from a normal distribution.
Furthermore, the stress that one platelet experiences along its trajectory can also be esti-
mated. For example, we can use the Boussinesq approximation to compute the total stress
(laminar plus turbulent stresses) applied to a single platelet, as
λ
is a random number between
2
X
t
max
ðε
i
2ε
i
1
1
Þ
2
i
Þ 1KE
i
3ρ
3 ðμ
i
1μ
3Δt
i
ð
13
:
19
Þ
t5t
0
i
where
ε
i
is the strain rate,
μ
i
is the viscosity,
μ
is the turbulent viscosity,
ρ
is the density,
KE
i
Δt
is the time step.
Figure 13.7
shows platelet trajectories calculated using the method discussed above. In
Figure 13.8
, the shear stress history of one platelet with an interesting trajectory was
is the turbulent kinetic energy, and

Search WWH ::

Custom Search