Biomedical Engineering Reference
In-Depth Information
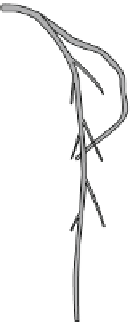
FIGURE 13.4
Left main coronary
Left circumflex
A three-dimensional model of the
left coronary artery with branches, generated by Pro-
Engineering software. This geometry can be imported
into most CFD software for flow field (velocity vec-
tors, pressure, among others) computation.
Diagonals
Left anterior descending
Septals
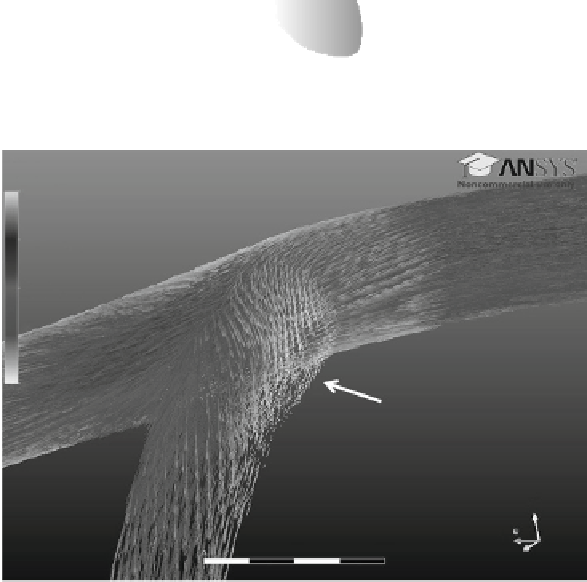
FIGURE 13.5
Velocity vectors
in the left coronary artery near
the bifurcation. Due to flow sepa-
ration at the bifurcation, a recir-
culation zone developed (arrow),
which can potentially trap cells
and induce non-normal
Velocity
W
4.000e
−
001
3.000e
−
001
2.000e
−
001
shear
stresses.
1.000e
−
001
0.000e
+
000
[m s
∧
−
1]
Z
Y
0.003
0.006 (m)
0.0045
X
0.0015
artery under normal and stenosis conditions can be characterized easily, using a normal
cardiac output as the inflow boundary conditions (these waveforms are therefore tran-
sient). Under normal flow conditions, due to the large bifurcation angle (about 75
between the left anterior artery and the left circumflex artery), the flow skewed toward the
left circumflex artery and separated from the blood vessel wall, causing a recirculation
zone to develop near the bifurcation region (
Figure 13.5
). With the presence of an 80% ste-
nosis approximately 8 mm downstream of the bifurcation in the left descending artery, the
flow field changes significantly. With the recirculation zone near the bifurcation, new
recirculation zones developed immediately distal to the stenosis, due to the jet flow
induced by the vessel narrowing.
Figure 13.6
(A) depicts the velocity vectors in the left
coronary artery near the stenosis, with a zoom-in view of the velocity vectors in the
recirculation zones shown in
Figure 13.6
(B).


Search WWH ::

Custom Search