Graphics Reference
In-Depth Information
Table 12.1
Color temperat
ures
Source
Temperature (K)
Source
Temperature (K)
Flame
1,800
Daylight, horizon
5,000
Incandescent light
3,000
Electronic fl ash
6,000
Studio light
3,400
Noon daylight
6,500
Moonlight, xenon lamp
4,100
CRT screen
9,300
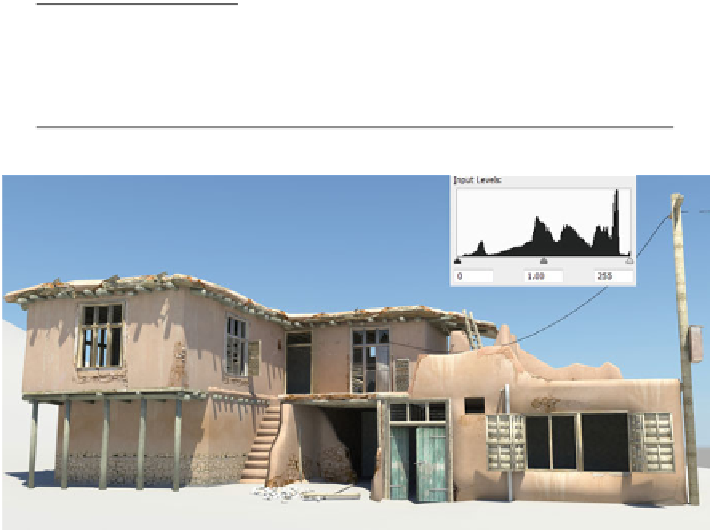
Fig. 12.8
The histogram at
upper right
provides a graphic representation of the color distribution
in this render (Image courtesy of Ali Faraji)
The colors in this table are fair approximations of the color of light given off by
various light sources. You can fi nd more detailed charts elsewhere with minimal effort.
12.5.7
Histogram
A
histogram
is a graph that shows the density and strength of colors in the image
(Fig.
12.8
). If the histogram has isolated peaks or wide fl at areas at or near the bot-
tom of the chart, the render does not have a good tonal range and should be adjusted.
If all the colors are too bright, the histogram will show the colors all bunched on the
right of the chart. If it is too dark, they will all be on the left. The histogram is a good
tool to see if a render has a good
dynamic range
of tonal values.
12.5.8
Composition
The
composition
of a render is the arrangement of objects within the frame dimen-
sions you have given it. The quality of a composition can be objectively rated up to


Search WWH ::

Custom Search