Biomedical Engineering Reference
In-Depth Information
1.00
Apoptosis
C
(τ)
0.75
Murine fibroblasts
C
(τ)
0.50
0.25
0.00
40
45
50
Temperature (°C)
(a)
1.00
0.75
C
(τ)
0.50
0.25
Apoptosis
Murine fibroblasts
0.00
40
45
50
55
60
Temperature (°C)
(b)
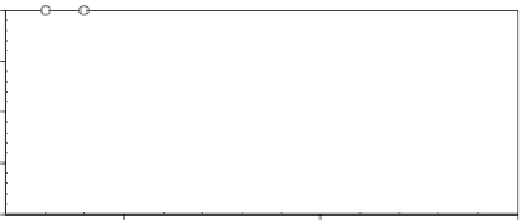
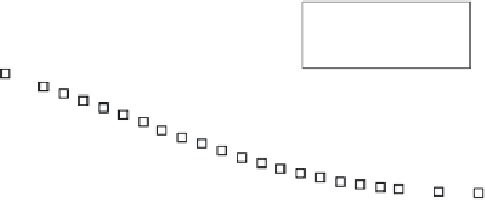
FIGURE 2.7
(a) Comparison of apoptosis/necrosis damage (squares) and murine fibroblast (with Hsp 70 production, circles) Arrhenius predic-
tions
vs
temperature for a 2-hour exposure (i.e., reheating in the case of the murine fibroblasts); (b) analogous plot to Figure 2.7a for 2 minutes of
exposure.
birefringence is lost—at higher temperatures in collagen than in
muscle—and birefringence loss is specific to thermal damage.
Relative birefringence intensity constitutes a quantitative histo-
logic marker, and is a useful indicator of thermal damage. In
the case of muscle, it is a certain indicator of anatomical dis-
ruption leading to irreversible electrophysiologic inactivation,
although this probably actually occurs at lower temperatures
when the transmembrane charge distribution collapses. In mus-
cle the surface appearance of “whitening” corresponds approxi-
mately to the boundary of birefringence loss, and representative
Arrhenius coefficients are given in Table 2.1.
(1)
There are also
Arrhenius coefficients for birefringence loss in collagen in the
table.
Collagen shrinkage is in routine clinical use for surgical pro-
cedures ranging from vessel fusion and correction of nasal septal
defects to cosmetic procedures. In the late 1990s, Chen et al.
(51-53)
presented a useful Arrhenius-based model that predicts colla-
gen shrinkage and ultimate jellification. Their formulation also
includes the effects of applied stresses, which somewhat stabilize
the collagen molecules. Adapting the method for use in numeri-
cal models of shrinkage processes is described by Pearce.
(17)
Briefly, the collagen exhibits a slow shrinkage phase (indicated
by τ
1
in Figure 2.8) followed by a rapid shrinkage phase up to a
maximum of approximately ξ = 60% in length, indicated by τ
2
in Figure 2.8.
The authors were able to collapse their entire experimental
data set into a single normalized equivalent exposure time, ν, in
terms of τ
2
, where:
t
(2.24)
ν=
ln
.
τ
2
60
ξ (%)
τ
1
τ
2
Time (log scale)
FIGURE 2.8
Sketch of collagen shrinkage model as derived from
experimental data by Chen et
al
.
(17)
and used by permission. The slow
shrinkage phase up to τ
1
is followed by rapid shrinkage up to τ
2
to a
maximum of about 60% in length, after which the collagen jellifies as
the temperature continues to increase. Collagen shrinkage is followed
by relaxation during cooling.