Biomedical Engineering Reference
In-Depth Information
1.00
0.75
C
(
τ
)
0.50
C
(
τ
) with Hsp70
0.25
C
(
τ
) without Hsp70
0.00
38
39
40
41
42
43
44
45
46
47
48
T (°C)
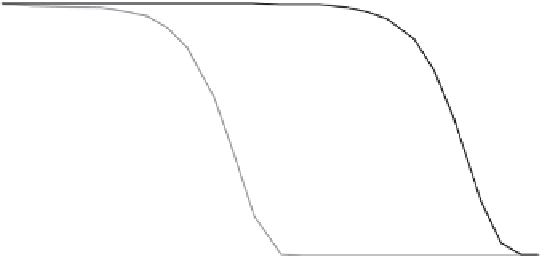
FIGURE 2.4
The protective effects of Hsp70 in murine embryonic blast cells may be seen in a plot of the surviving fraction
vs
temperature for
exposures of 60 minutes, also a sigmoidal relationship.
where the constant in the denominator is
RT
at 43°C. For
the Chinese hamster ovary cells, τ
43
= 447 minutes. Beckham
et al.
(33,34)
studied the protective role of the heat shock protein
Hsp70 in murine embryonic fibroblasts using bioluminescent
imaging. The thermal sensitivity was measured in intact cells
and those with Hsp70 production blocked: cells were preheated,
and then heated again 4 hours later for the measurement.
With Hsp70 production intact the Arrhenius parameters for
reheated cells are:
A
= 3.7 × 10
157
(s
−1
) and
E
a
= 9.8 × 10
5
(J mole
−1
),
τ
43
= 22.1 × 10
3
s (368 minutes). In the Hsp70 deficient cells the
reheating damage coefficients are:
A
= 6.9 × 10
116
(s
−1
) and
E
a
=
7. 3 × 10
5
(J mole
−1
), τ
43
= 5.87 × 10
3
s (97.9 minutes). Hsp70 pro-
vides nearly a 4:1 improvement in thermotolerance in these cells
by this measure—as in Figure 2.4. Interestingly, the
T
Tcrit
values
are reversed in the two experiment groups: 51.7°C and 53.2°C,
respectively.
Borelli et al. determined thermal damage coefficients for Bhk
cells
in vitro.
(35)
of integrity in the bi-lipid layer. Przybylska et al.
(36)
compared
hemolysis rates in normal and Down syndrome patient RBCs,
but did not report values for
A
or Δ
S
*—the estimates for
A
given
in Table 2.1 were derived from Wright's line, Equations 2.11a,b.
Lepock et al.
(37)
measured thermal denaturation of hemoglobin.
A comparison of the two sets of parameters at a high fever
temperature of 42.8°C (109 °F) is shown in Figure 2.5, along with
the Down syndrome results. Despite the slight difference in rates
(i.e.,
E
a
) between Down syndrome and normal patients reported
by Przybylska et al., there is no detectable difference in the pre-
dicted hemolysis at this temperature. Note also that the Lepock
et al. coefficients predict that the hemoglobin would be robust
against denaturation for at least 100 hours (more than 4 days) at
this temperature. Practical clinical experience suggests that the
Przybylska et
al. coefficients do provide a reasonable estimate of
the onset of hemolysis under these conditions.
2.3.3.3 Skin Burns
Skin burns make an interesting example because, in addition
to being the classical regime for thermal damage studies, the
dominant process in skin burns is disruption in the vasculature,
mostly the capillary microvasculature. Diller et al.
(38)
provide
2.3.3.2 Membrane Disruption
Cell membranes experience a mostly a nonproteinaceous dam-
age process, although breakdown of intrinsic and extrinsic
membrane proteins is equally likely to occur in parallel with loss
1.00
0.75
C
(τ)
0.50
C
(τ) Lepock
0.25
C
(τ) Przybylska Norm
C
(τ) Przybylska Downs
0.00
1.0E-03 1.0E-02 1.0E-01 1.0E+00 1.0E+01 1.0E+02 1.0E+03 1.0E+04 1.0E+05
Time (h)
FIGURE 2.5
Prediction of hemolysis from Przybylska et al.
(36)
and hemoglobin denaturation from Lepock et al.
(37)