Biomedical Engineering Reference
In-Depth Information
the temperature at which the rate of damage accumulation,
d
Ω/
dt
= 1 (s
−1
):
on covering, latitude, and season of the year. Nevertheless, it is
important not to calculate any thermal damage process below
the lowest temperature at which the process has been observed.
For the classical skin burn example the traditionally accepted
lower temperature limit is 45°C, at which temperature Ω = 1 at
11,309 s, or 188 hours from those coefficients.
E
RA
a
T
=
ln{}
.
(2.10)
Tcrit
Functionally, the remaining undamaged tissue constituent,
C
(τ), decreases sigmoidally with time at constant temperature,
and also decreases sigmoidally with temperature for a constant
exposure time. Several calculations follow in a later section that
illustrate this behavior. Also, the rate of damage accumulation,
d
Ω/
dt
, is vanishingly small at low temperature and increases
precipitously above
T
Tcrit
. As a usual consequence, it is far too
tempting to describe thermal damage as occurring at a specific
temperature; however, as in Equation 2.9, the time of exposure
is important as well and must be reported when discussing
results. For example, a hypothetical damage process for which
E
a
= 5 × 10
5
(J mole
−1
) and
A
= 7. 0 7 × 10
78
(s
−1
) has
T
Tcrit
= 58.1°C.
For an exposure typical of hyperthermia treatment times, 1 hour
(τ = 3600 s), and 90% thermal damage probability (Ω = 2.303),
and from Equation 2.9,
T
TH
= 45.2°C. For an exposure typical of
an ablation procedure (e.g., τ = 60 s) the threshold temperature
increases to 52.2°C; and if the exposure is a 1 ms laser pulse,
T
TH
= 72.8°C.
There is a logical trap to be wary of in universally applying
the Arrhenius formulation. Mathematically, thermal damage
can occur at extremely low rates at normal body temperatures.
For example, using the Diller et al. skin burn coefficients(27)
(27)
from
Table 2 .1—
A
= 8.82 × 10
94
(s
−1
),
E
a
= 6.03 × 10
5
(J mole
−1
)—at
37°C
d
Ω/
dt
= 2.47 × 10
−9
(s
−1
). We would expect 63.2% thermal
damage in about 4.04 × 10
6
(s), or 7.69 years. This is, of course,
nonsense. It is difficult, if not impossible, to accept any thermal
damage prediction at normal body temperatures. Of course,
skin cells are continually replaced at a much higher rate than
that by normal attrition (originating in the granulating layer)
due to multiple damage processes (dehydration, ultra violet
exposure, abrasion, and so forth); and resting exposed skin tem-
perature is less than 37°C, ranging from 30°C to 35°C depending
2.3.2.2 Determining process Coefficients in
Constant temperature Experiments
The process coefficients,
A
and
E
a
, can only be determined from
theoretical calculations in the simplest of reactions in gas phase
at low pressure. All processes of practical interest must be studied
experimentally. We do have predictive limits to work within, how-
ever. Eyring and Stearn
(25)
point out that the Gibb's free energy of
activation, Δ
G
*, varies only over a relatively narrow range: they
list 21 values for the denaturation of hydrated enzymes from lit-
erature that range from a low of Δ
G
* = 91.7 (kJ mole
−1
) for pepsin
at 25°C—that is, Δ
H
* = 232.7 (kJ mole
−1
) and Δ
S
* = 474.3 (J mole
−1
K
−1
), with
A
= 3.7 × 10
37
—to a high of Δ
G
* = 107.6 (kJ mole
−1
) for
invertase, an enzyme that catalyzes the hydrolysis of sucrose, at
55°C—that is, Δ
H
* = 361.5 (kJ mole
−1
), and Δ
S
* = 774 (J mole
−1
K
−1
), with
A
= 1.84 × 10
53
. The consequence is that Δ
H
* and Δ
S
*
are approximately linearly related, as derived by Miles
(28)
using a
“polymer in a box” construct to describe collagen denaturation.
In an extremely insightful recent article, Wright
(29)
plotted a large
number of published values for tissue damage process coefficients
on ln{
A
}-
E
a
axes with the result that:
E
=× +×
2.61
10
3
ln{} 2.62
A
10
4
(2.11a)
a
or
ln{} 3.832
A
=
×
10
−
4
E
−
10.042
(2 .11b)
a
with a very high degree of correlation—and
E
a
is in units of
J mole
−1
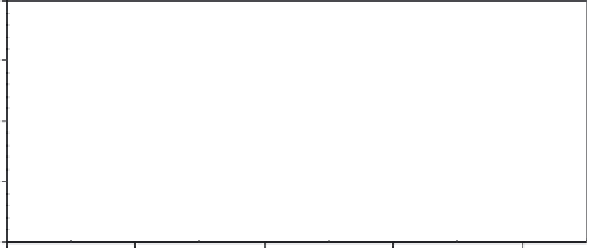
, as in the preceding discussion. Figure 2.2 compares
Equation 2.11b to the data in Tables 2.1 and 2.2.
400
300
ln{
A
}
200
100
0
1E+05
3E+05
5E+05
7E+05
9E+05
E
a
FIGURE 2.2
Plot of Arrhenius parameters for tissues listed in Table 2.1 (open circles) and proteins from Erying and Stearn
(25)
listed in Table 2.2
(solid squares) compared to Wright's Line, Equations 2.11a,b. A subset of the data included in Table 2.1 was used by Wright to determine the line,
along with many additional sources.