Biomedical Engineering Reference
In-Depth Information
(c)
(d)
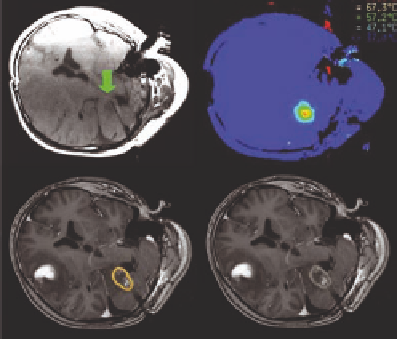
FIGURE 3.1
MRI guidance of laser ablation of brain lesion. In addition to planning the procedure, MRI is useful for targeting the volume of
interest and verifying correct location (green arrow) of devices for therapy delivery (a). MR temperature imaging provides a spatiotemporal map
of the temperature that can be used to help control delivery for safety and efficacy (b). The temperature history can be integrated with biological
models that predict damage (orange contour) as shown in (c), which may be used as a surrogate for predicting the treatment endpoints during the
course of therapy as opposed to more time-consuming posttreatment verification imaging, such as contrast-enhanced imaging, which demon-
strates the perfusion deficit left by therapy and enhancing ring of edema (d).
0-1
1-2
2-3
3-4
4-5
5-6
6
5
4
3
20
2
16
1
12
0
8
900
800
700
600
500
400
4
300
200
100
Frequency (MHz)
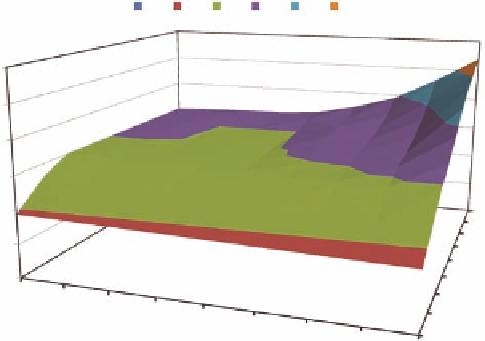
FIGURE 4.6
Dependence of effective penetration depth
d
ef
into muscle-like tissue associated with square aperture sources upon frequency
f
and
aperture size
a
. The surface
d
ef
(
f
,
a
) is colored according to 1 cm increments in
d
ef
.
Z
Z
X Y
X
Y
0
-8
-16
-24
-32
-40
Z
X
Y
FIGURE 4.9
Top left: three-turn induction coil modeled as three concentric circular loops (radii 10, 8, and 6 cm) placed 3 cm above a plane-
layered fat-muscle-fat phantom. Each loop is driven by a current source at 30 MHz. Top right: vector plot of current density
J
in planes × = 0 and
y = 0. Bottom: The resulting SAR distribution (in dB relative to the maximum SAR) in the × = 0 plane.