Biomedical Engineering Reference
In-Depth Information
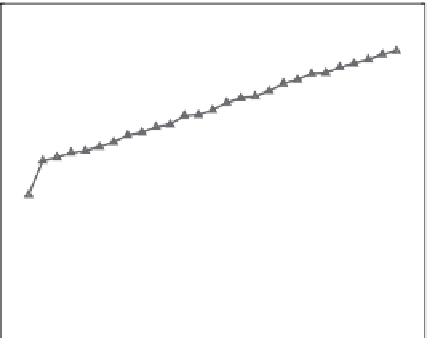
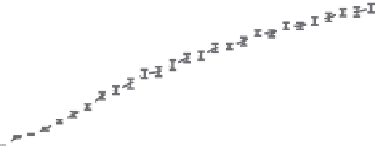
(a)
CBE from simulated images with additive noise
(b)
Predicted effect of backscatter coe
cient
6
4
3
4
Lipid scatterer
2
2
Positive CBE
Negative CBE
1
Mean of positive CBE
Mean of negative CBE
0
0
−1
−2
Aqueous scatterer
−2
−4
−3
36
38
40
42
44
46
48
50
36
38
40
42
44
46
48
50
Temperature (°C)
Temperature (°C)
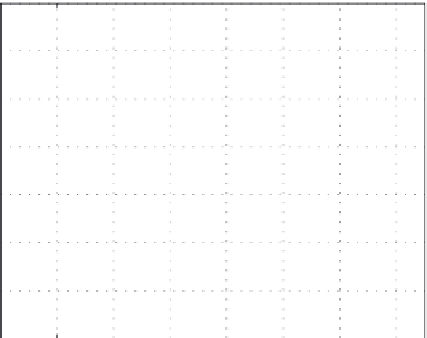
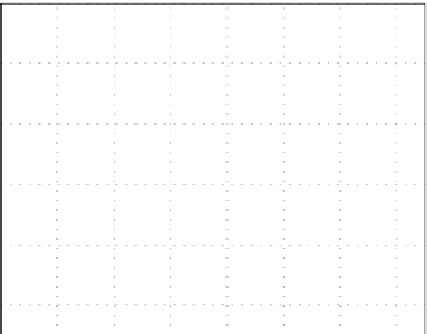
(c)
Positive and negative CBE in tissue
6
4
2
Bovine liver
Turkey breast
Pork muscle
0
−2
−4
36
38
40
42
44
46
48
50
Temperature (ºC)
FIGURE 13.9
(a) Predicted CBE for single, sub-wavelength lipid and aqueous scatterers in an aqueous medium with thermal properties given by
our initial theoretical study (similar to Figure 5 in Arthur et al.
91
). (b) CBE from simulated 1 × 1 cm B-mode images with collections of scatterers
(2000 aqueous and lipid scatterers in a 2:1 ratio) in the presence of noise (similar to Figure 8 in Trobaugh et al.
57
). (c) Means of measured CBE in
positive and negative regions of backscattered-energy images in four specimens of bovine liver, two of turkey breast, and one of pork muscle. The
error bar is the standard error of the mean estimated from eight regions of interest in each of the tissue specimens (similar to Figure 8 in Arthur
et al.
43
).
identically distributed random variables, the nominator approxi-
mates the integral
13.4.4.2 Effect of Signal-to-Noise ratio, temperature
range, and Insonification Frequency
In order to investigate CBE for populations of scatterers, we devel-
oped an ultrasonic image simulation model, including tempera-
ture dependence for individual scatterers based on predictions
from our theoretical model.
57
CBE computed from images simu-
lated for populations of randomly distributed scatterers behaves
similarly to experimental results, with monotonic variation of
CBE for both individual pixel measurements and over image
regions. Effects on CBE of scatterer type and distribution, size
of the image region, and signal-to-noise ratio affect temperature
accuracy and spatial resolution. This simulation model also pro-
vides the basis for gaining a better understanding of the effects of
∫
∞
. The denominator
approximates
the probability of
z
being larger than 1. Thus, PCBE is defined
as the normalized mean of
z
over
z
∈ [1,
∞
). Similarly, NCBE is
defined as normalized mean of
z
over
z
∈ (0,1). hu s
zf
()
zdz
1
Z
∞
1
∫
∫
∫
∫
zf
()
zdz
zf
()
zdz
Z
Z
PCBE
=
1
;
NCBE
=
0
.
(13.11)
∞
1
fzdz
()
fzdz
()
Z
Z
1
0
From these definitions, PCBE and NCBE are in fact statistics
of the signal ratio and are determined by the ratio distribution
f
Z
(
z
).
46