Biomedical Engineering Reference
In-Depth Information
then normalizing the resulting spectrum by the sample thick-
ness.
103
The frequency dependence of the attenuation coefficient
is usually determined by a linear fit to the data over the useful
bandwidth of the measurement system.
103-105
Attenuation is more difficult to measure from single backscat-
tered signals in tissue, that is, without a reference signal. Methods
for setting bounds on the estimates of the attenuation of small tis-
sue regions, particularly at temperatures below 50°C, may be useful
in determining limits on accuracy and spatial resolution of atten-
uation-based temperatures.
106
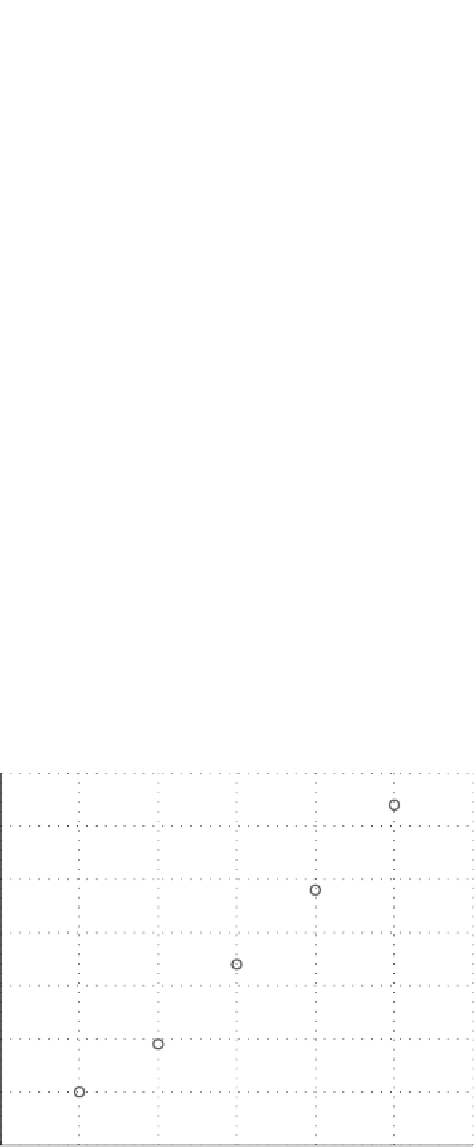
The slope of attenuation found for a
linear fit of attenuation shown in Figure 13.6 for four temperatures
in dog myocardium is linear with temperature.
75
The attenuation
curves at 2 MHz are not fit well, however, by a straight line, but
are by a single-pole model
107
curve superimposed on the measure-
ments in this figure. The pole locations shown in Figure 13.6 as a
function of temperature may be a better choice for characterizing
the temperature dependence of attenuation for temperature imag-
ing, particularly at temperatures below 50°C.
Attenuation changes with temperature appear to be more
pronounced at temperatures above 50°C than in the hyperther-
mia range. Several groups have investigated the temperature
dependence above 50°C in tissue.
90,108,109
Damianou and cowork-
ers investigated the temperature and the frequency dependence
of ultrasonic attenuation and absorption in soft tissues.
90
hey
found that attenuation was highly dependent on temperature,
but only at temperatures >50°C. Techavipoo and coworkers mea-
sured attenuation of canine tissue from 25 to 95°C with different
tissue samples heated to different target temperatures to reduce
cumulative tissue degradation. They found that attenuation at
3, 4, and 5 MHz was relatively unchanged from 40 to 60°C, but
increased sharply above 60°C.
110
In measurements of insertion
loss at room temperature before and after heating, increases in
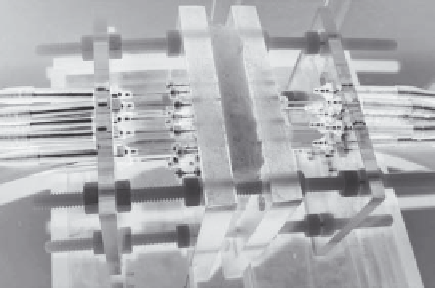
ermocouples
Tube
FIGURE 13.5
Configuration for nonuniform heating experiments.
Tissue was imaged in a 37°C water bath with a 7.5 MHz linear array
in the plane of the tissue. Heating was provided by 65°C water pumped
through a 1 cm diameter silicon tube in the center of the tissue speci-
men. Thermocouple holders with fitted slots for the thermocouple
shafts provided support to reduce movement of the thermocouple tips
in the tissue.
13.4.2 attenuation
The accepted method for measuring the attenuation coeffi-
cient is by use of a shadowed-reflector “substitution” technique.
A reference RF trace (corresponding to the specular echo from
a stainless-steel reflector through water only) and an RF trace
corresponding to the reflected signal after it has passed through
the tissue specimen are required. If the power spectra of the
reference trace and the through-sample trace are found, then
attenuation can be computed by subtracting the power spectrum
through the sample from the spectrum of the reference in the
logarithmic domain, correcting for interface insertion losses,
Dog myocardium
Dog myocardium
8.4
0.7
Single-pole model
Regression line
8.2
0.6
8
0.5
7.8
0.4
7.6
7.4
0.3
7.2
0.2
20.5
o
C
25.0
o
C
30.0
o
C
37.0
o
C
7
0.1
6.8
6.6
0
15
20
25
30
35
40
0
2
4
6
8
10
12
Frequency (MHz)
Temperature (°C)
FIGURE 13.6
(Left) Attenuation of dog myocardium at four temperatures predicted by a single-pole tissue model. Data points were taken from
the work of O'Donnell et al.
75
Temperatures indicated with each part are in degrees Celsius. Height of the vertical bar at each measurement is the
standard error. (Right) Dependence of relaxation frequency of the single-pole model on the temperature of dog myocardium.
107
Transfer functions
of the single-pole model were calculated from data shown in the left panel above.