Biomedical Engineering Reference
In-Depth Information
Top
Coronal
Left
Right
Patient
Sagittal
Bottom
FIGURE 8.13
Schematic configuration of the Sigma applicator series.
Each dual dipole antenna is connected to an RF power source.
Axial
demonstrates that the SAR distribution induced at the central
cross-section of a homogeneous abdomen equivalent phantom
possesses predominantly a Gaussian shape for the complete
operational frequency range [79]. The longitudinal length of the
50% iso-SAR area is 21 cm at 70 MHz and roughly 19 cm at 120
MHz (i.e., nearly independent of the frequency). The reduction
of the radial length of the 50% iso-SAR area from 15 to 9 cm for
a frequency increasing from 70 to 120 MHz reflects the focusing
effect at higher frequencies. This effect is visually demonstrated
for a patient in Figure 8.15. It shows the changes by >5 W/kg
(blue [darkest grey] decrease and red [medium grey] increase)
in the predicted SAR distribution for an average patient with
locally advanced cervical cancer after increasing the operat-
ing frequency from 75 MHz to 85 and 95 MHz, respectively.
Increasing the frequency causes a more focused central heating
(red [medium grey]) and less heating at the lateral parts of the
patient (blue [darkest grey]). The figure also shows more energy
deposition cranially of the target (i.e., tumor indicated in pink
[dark grey in center of body]). Careful comparison is needed to
SAR
85
-SAR
75
SAR
95
-SAR
75
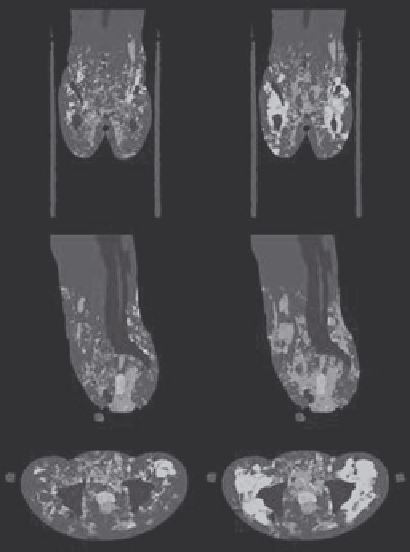
FIGURE 8.15 (See color insert.)
Comparison of the SAR distribu-
tions of 75 MHz to that of 85 and 95 MHz in the same patient. Changes
in local SAR by >5 W/kg, increase in red and decrease in blue are pre-
sented for an average patient with locally advanced cervical cancer.
decide whether the increased SAR in the target is not limited by
the unwanted increased SAR deposition cranially of the tumor.
A study by van Rhoon et al. [79] also confirmed the excel-
lent SAR steering feasibility of the BSD-2000 system with the
Sigma 60 under laboratory conditions. The location of the
maximum SAR in the measured radial SAR profiles follows
closely the selected target position. Small differences between
the requested target position and the measured SAR maximum
are to be expected due to the simplified theoretical algorithm
used to calculate the required phase setting of each dipole pair
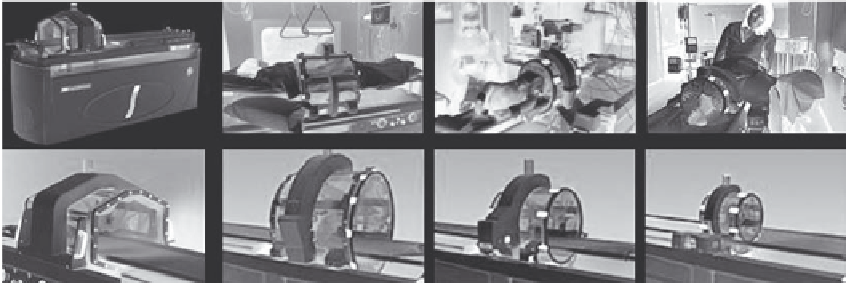
Sigma 60-E
Sigma 60
Sigma 40
Sigma 30
FIGURE 8.14
BSD-2000 family: Sigma-60-E (ellipse), Sigma-60, Sigma-40, and Sigma-30 applicator.