Biomedical Engineering Reference
In-Depth Information
Linear propagation
Nonlinear propagation N = 1
60
60
0.2
0.2
t = 0.3 s
t = 0.3 s
50
50
0.1
0.1
40
40
0
2
0
2
2.5
3
3.5
4
4.5
2.5
3
3.5
4
4.5
60
60
0.2
0.2
t = 0.8 s
t = 0.8 s
50
50
0.1
0.1
40
40
0
2
0
2
2.5
3
3.5
4
4.5
2.5
3
3.5
4
4.5
60
60
0.2
0.2
t = 1.5 s
t = 1.5 s
50
50
0.1
0.1
40
40
0
2
0
2
2.5
3
3.5
4
4.5
2.5
3
3.5
4
4.5
60
60
0.2
0.2
t = 2.2 s
t = 2.2 s
50
50
0.1
0.1
40
40
0
2
0
2
2.5
3
3.5
4
4.5
2.5
3
3.5
4
4.5
Axial distance (cm)
FIGURE 6.14
Simulated temperatures generated with a spherically focused transducer that is coaxially aligned with a 0.4 mm diameter blood
vessel. Plots on the left are computed with a linear ultrasound propagation model, and plots on the right are computed with a nonlinear ultrasound
propagation model. (After F. P. Curra, P. D. Mourad, V. A. Khokhlova, R. O. Cleveland, and L. A. Crum,
IEEE Trans. Ultrason. Ferroelect. Freq.
Contr.
, 47, 4, 2000.)
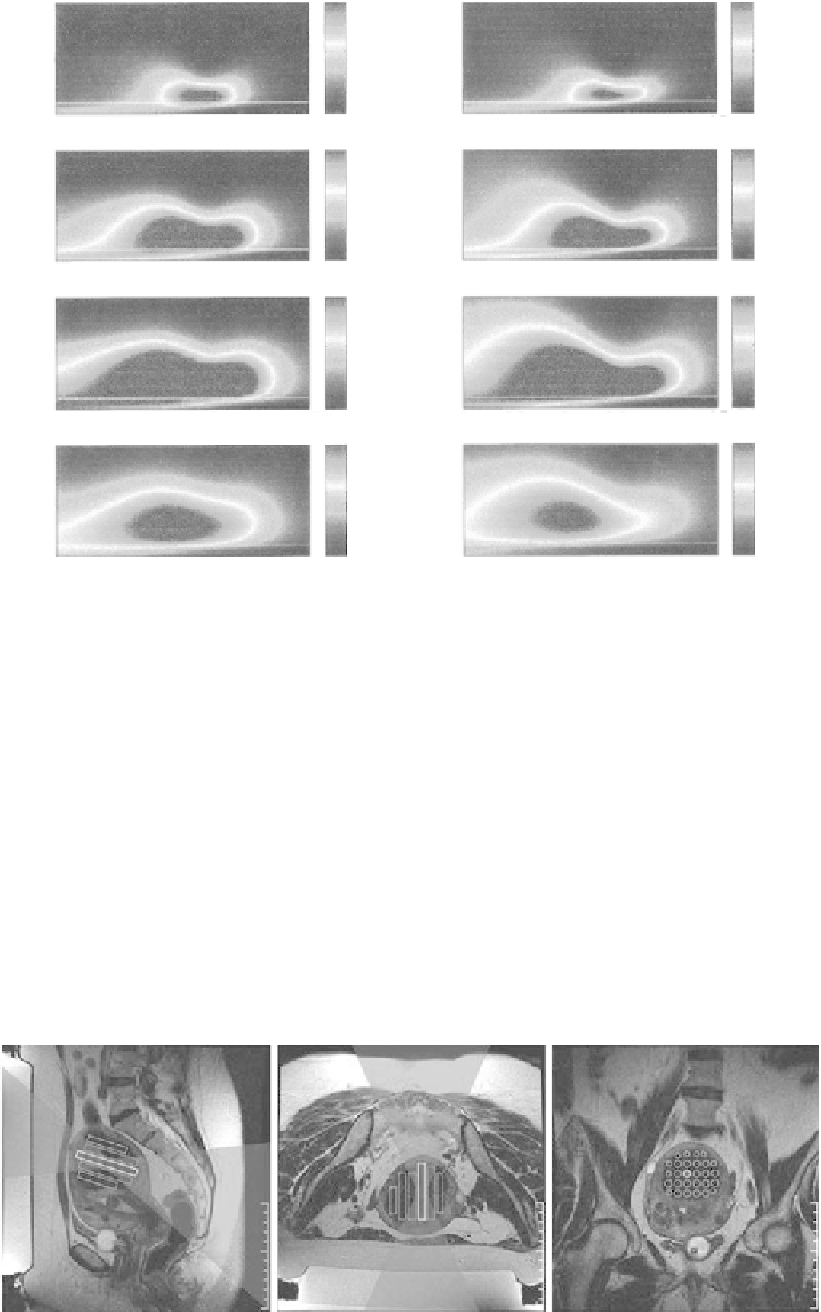
Treatment planning for ultrasound ablation of uterine fibroids
optimizes the path of the ultrasound beam and the distribution
of lesions within the target volume (Tempany et al. 2003). These
treatment plans, which are based on T1-weighted and T2-weighted
magnetic resonance images collected prior to the treatment, define
the size, volume, and location of the fibroids and other structures.
The orientation of the phased array is established prior to the
treatment with software that simultaneously displays magnetic
resonance images and a simplified model of a focused ultrasound
beam. This combination facilitates avoidance of bowel loops and
scars in the beam path, where the applicator is translated and/or
tilted as needed to avoid these structures. Figure 6.15 contains
an example of 3D treatment planning for MR-guided ultrasound
ablation of a uterine fibroid (Shen et al., 2009). The left panel shows
an example of a beam that was tilted to change the beam angle on
the sacrum, the center panel shows an orthogonal cross section
and the lesion sizes in that cross section, and the right panel indi-
cates the spacing between sparsely packed lesions.
FIGURE 6.15
An example of geometric treatment planning, where the ultrasound phased array is tilted to avoid bowel loops and scars. (After
S. H. Shen, F. Fennessy, N. McDannold, F. Jolesz, and C. Tempany,
Semin
.
Ultrasound CT MR,
30, 2, 2009.)