Biomedical Engineering Reference
In-Depth Information
operating frequencies of 4.7 and 9.7 MHz. The applicator is con-
tinuously rotated within the urethra throughout the simulated
treatment, where the power settings and excitation frequencies
are determined by a feedback algorithm that controls the tem-
peratures in a single 2D plane. In these simulations, the pres-
sures are simulated with the rectangular radiator method, and
temperatures are computed with a finite difference implementa-
tion of a 3D bioheat transfer model. The bioheat transfer simula-
tions demonstrate that this applicator, when combined with the
control algorithm, conforms thermal damage patterns to the
outer boundary of the prostate (Figure 6.12). These simulation
results also successfully predict the extent of thermal damage
obtained in measurements with tissue-mimicking gel phantoms.
Related simulation studies show that when the control algorithm
is extended to 3D, conformal thermal coagulation is achieved in
realistic 3D prostate models (Burtnyk et al. 2009). Other simula-
tions evaluate the thermal dose in the rectum, the pelvic bone,
the neurovascular bundle, and the urinary sphincters during
transurethral ultrasound ablation of the prostate, and the results
of these simulations suggest treatment planning strategies that
can reduce thermal injury to these sensitive structures (Burtnyk
et al. 2010).
Treatment planning for transrectal HIFU defines 3D ana-
tomical models of the prostate target and other tissue structures
(Seip et al. 2004) and optimizes parameters for thermal ablation
(Fedewa et al. 2005). The 3D anatomical models of the prostate,
urethra, and rectal wall are obtained from diagnostic ultra-
sound images that are manually segmented and then param-
eterized. The resulting 3D anatomical structures, which can be
combined with other models that describe the location of the
neurovascular bundle and other sensitive normal tissues, pro-
vide the input for treatment optimization and 3D visualization.
The treatment plan then optimizes the locations of the lesions
subject to multiple constraints on the spacing between adjacent
lesions, the extent of the treated margin beyond the prostate
capsule, and the maximum treatment angle of the mechani-
cally rotated ultrasound transducer. The optimization proce-
dure, which calculates treatment parameters for two different
90
90
(a)
(b)
40
135
45
40
135
45
20
20
180
0
180
0
0
0
20
20
225
315
225
315
40
40
270
270
90
90
(c)
(d)
40
40
135
45
135
45
20
20
180
0
180
0
0
0
20
20
225
315
225
315
40
40
270
270
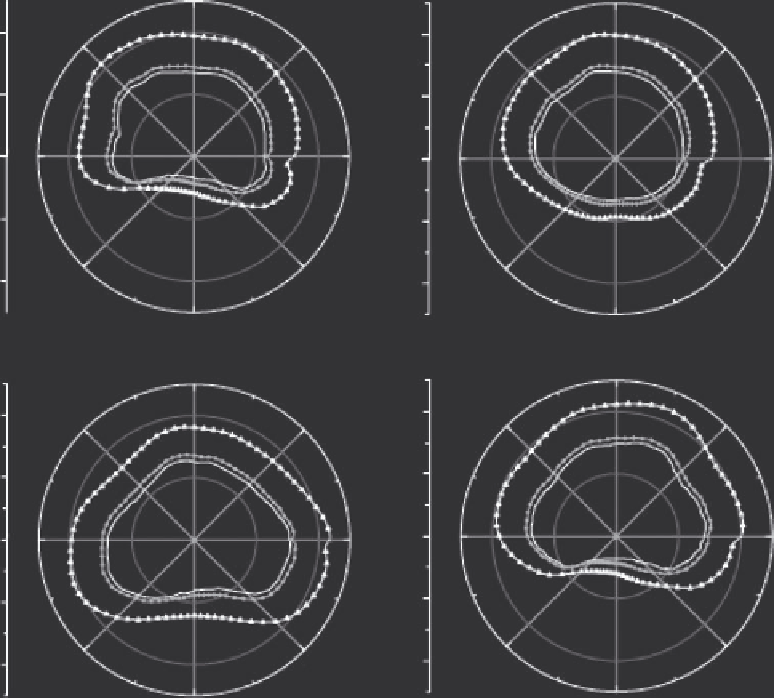
FIGURE 6.12
Simulated ultrasound ablation with a rotating transurethral applicator evaluated in four different prostate models. In each plot,
the innermost contour represents the outer prostate boundary, the contour with circle markers located just outside of the prostate indicates the
100% cell kill boundary, and the outermost contour with triangle markers indicates the 0% cell kill boundary. (After R. Chopra, M. Burtnyk,
M. A. Haider, and M. J. Bronskill,
Phys. Med. Biol.
, 50, 21, 2005.)