Biomedical Engineering Reference
In-Depth Information
programming, and the result describes the array excitation
covariance matrix. The cost function defined for waveform
diversity beamforming maximizes the difference between the
power deposited at a representative tumor control point and the
power deposited at the control points in sensitive normal tissues.
Some of the constraints guarantee that the power deposited at
the remaining tumor control points is comparable to that at the
representative control point, and other constraints specify the
total acoustic power generated by the ultrasound phased array
while maintaining positive power values for each transducer
element. The array excitation covariance matrix describes the
optimal driving signals that satisfy the constraints while mini-
mizing the cost function. The optimal number of multiple focus
patterns is defined as the rank of the covariance matrix, and the
driving signals are obtained from the singular value decom-
position of the covariance matrix. When waveform diversity
calculations are combined with mode scanning, all of the mul-
tiple focus patterns achieve on-axis cancellation while the com-
putation time and the amount of computer RAM required are
significantly reduced. This combination of waveform diversity
and mode scanning is especially important for computationally
intensive calculations with large ultrasound phased arrays with
thousands of elements. Further improvements in conformal
tumor heating are obtained when waveform diversity and mode
scanning are combined with an adaptive algorithm that removes
focal points from the interior of the tumor volume to improve
conformal tumor heating (Jennings and McGough 2010). When
focal points are distributed throughout the tumor, the interior
temperatures are higher, and when focal points are removed
from the interior, more uniform heating is achieved. With this
approach, the focal points heat the tumor periphery, and the
overlapping contributions from the multiple focus patterns heat
the interior portion of the tumor.
Beamforming and bioheat transfer simulations, when com-
bined with geometric aperture optimization and 3D visu-
alization, also define a treatment planning framework for
hyperthermia with ultrasound phased arrays (McGough et al.
1996). For patient treatment planning, all of these calculations
are interfaced to a 3D patient model that is extracted from CT or
MRI scans. Based on this model, the geometric aperture is opti-
mized in an effort to reduce interactions between the ultrasonic
power deposition and air or bone obstructions. If the results of
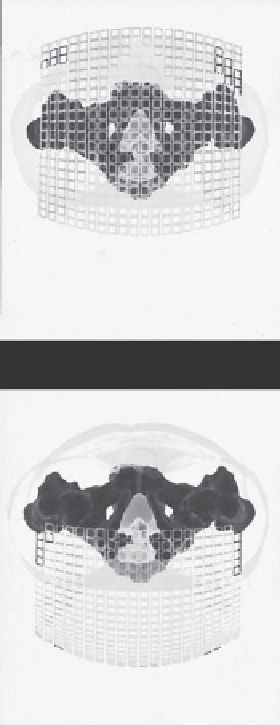
geometric aperture optimization indicate that the acoustic win-
dow is smaller than the available array aperture, then the array
is centered relative to the acoustic window and excess array ele-
ments are turned off. By deactivating these blocked elements,
the phased array aperture is effectively conformed to the avail-
able acoustic window (Figure 6.10). The geometrically opti-
mized array aperture then provides the input for beamforming
and thermal optimization procedures. Once the optimal beam
patterns are determined, simulated power depositions and tem-
perature distributions are projected onto the tumor and other
important anatomical structures and visualized in three dimen-
sions. Results of different heating strategies are then evaluated
and compared. In the context of prospective treatment planning,
(a)
(b)
FIGURE 6.10 (See color insert.)
(a) Unoptimized and (b) optimized
ultrasound phase array apertures for hyperthermia in the prostate.
(After R. J. McGough, M. L. Kessler, E. S. Ebbini, and C. A. Cain,
IEEE
Trans. Ultrason. Ferroelect. Freq. Contr.
, 43, 6, 1996.)
3D visualization is useful for identifying the locations of poten-
tial bone heating, normal tissue hot spots, and tumor cold spots,
and when realistic patient anatomical models are combined with
3D visualization of isothermal surfaces, the simulated size of the
tumor volume that reaches a therapeutic temperature or ther-
mal dose target value is also demonstrated. The 3D visualization
provides valuable feedback during patient treatment planning,
where the results are incorporated into the final treatment plan
as needed.
A related treatment planning strategy has also been devel-
oped for hyperthermia with transurethral applicators (Chen
et al. 2010). These hyperthermia applicators, which are placed
within brachytherapy implants, consist of linear and sectored
arrays with variable power control along the length of the device
and in different directions. Treatment planning for these appli-
cators combines a 3D bioheat transfer model with a tempera-
ture optimization algorithm and a geometric planning approach
that includes 3D visualization of the anatomy, applicator, and
temperature fields. The temperature optimization algorithm