Biology Reference
In-Depth Information
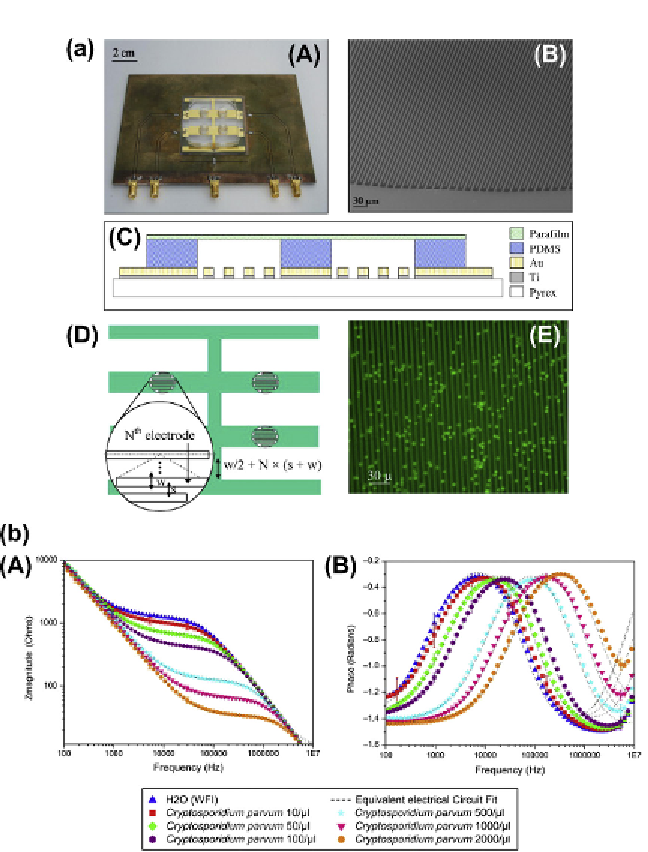
Figure 10.7
(a) (A) Picture of the biochip bonded to the PCB. (B) SEM picture of elec-
trodes on array edge. (C) Side view schematic of biochip structure. (D) Schematic of
electrodes layout on biochip. Schematic in inset explains the method to calculate cell
constant. (E) Fluorescent and DIC picture of
C. parvum
oocysts on microelectrodes.
Oocysts were stained with a green fluorescent marker. (b) Bode plots of the electro-
chemical impedance for
C. parvum
oocysts suspended in WFI with different concen-
trations. (A) Impedance magnitude spectrums and (B) impedance phase spectrums.
Source:
Reproduced with permission from Ref.
108
(Figures 1 and 4).
(For color version of
this igure, the reader is referred to the online version of this topic.)
Search WWH ::

Custom Search