Biology Reference
In-Depth Information
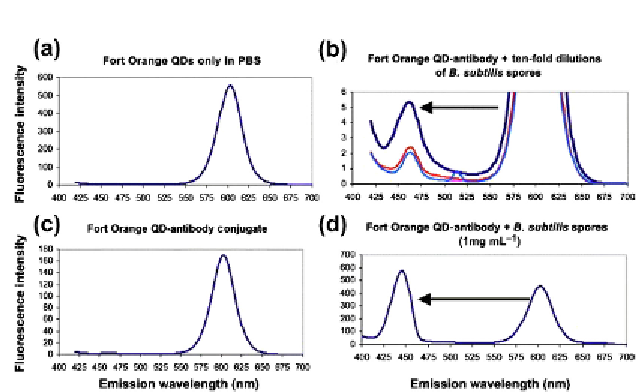
Figure 9.5
Fluorescence emission spectra of Fort Orange QDs before conjugations to
IgG antibody (a), after conjugation (b), and after binding increasing amounts of bacte-
rial spores (c, d). Source:
Adapted from Ref.
37
and reproduced in Ref.
6
.
(For color version
of this igure, the reader is referred to the online version of this topic.)
in correlation with the number of bacteria while the original QD emis-
sion peak reduces (
Fig. 9.5
). Another alternative strategy was developed by
Mukhopadhyay et al. who used QDs to induce
E. coli
aggregation with an
LOD of 10
4
bacteria mL
−1
.
38
This method will evidently work well at high
concentrations. However, it will not be as applicable for approaching single
cell LODs.
In 2004, Zhu et al. reported the use of QDs to detect
Cryptosporidium
and
Giardia
in water samples.
39
The advantages of QDs over traditional
fluorophores resulted in higher signal to noise ratios, greater photostability,
and dual-color detection of these pathogens.
QDs have also been used in conjunction with flow cytometry. In 2008,
Hahn and co-workers reported the use of QDs for the flow cytometric
detection of
E. coli
O157:H7, claiming brighter fluorescent intensities,
lower detection limits, and greater specificity than traditional probes.
40
The
LOD was 10
6
cells mL
−1
, in a background of 100 times as many cells of
another
E. coli
strain. In contrast, in 2007, Ferrari et al. found that flow
cytometric detection of
Cryptosporidium
with QDs was worse than with
organic fluorophores, reporting both a lower fluorescence intensity from
QDs and greater nonspecific binding.
41
Given their findings a year later, it
was determined that the minimum fluorophore concentration required for
detection was 100-fold less than FITC.
42
This suggests that optimization of
Search WWH ::

Custom Search