Game Development Reference
In-Depth Information
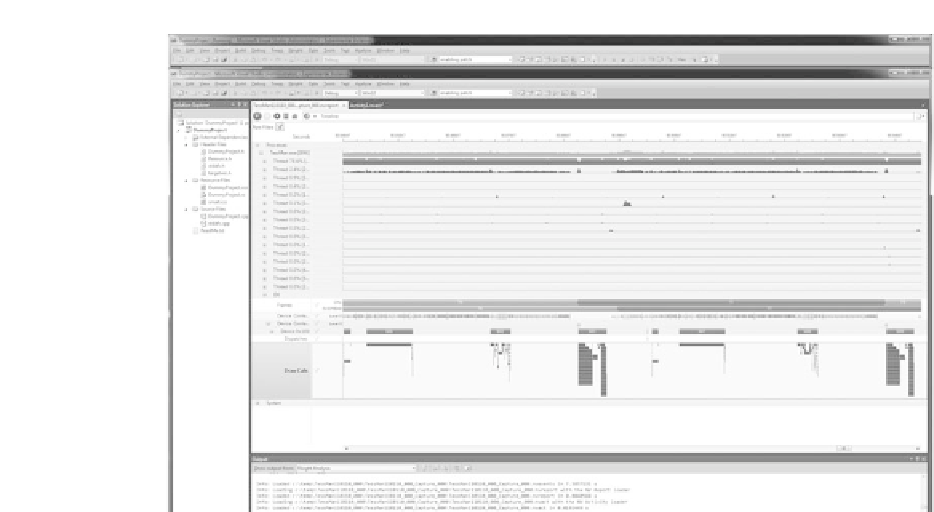
Figure 21.12.
CPU utilization from the trace.
threads waiting are either not CPU bound or may not be eciently utilizing the
available cores.
GPU workloads and memory transfers.
The Parallel Nsight Analyzer is also
capable of displaying workloads as they are executed on the GPU, including draw
callsandmemorytransferevents(see
Figure21.13
)
.
This information is useful for determining when a given draw call is actually
executed on the GPU and what calls are potentially stalled waiting for the results
of a previous draw call.
Using custom ranges and markers.
The Parallel Nsight Analyzer visualizes a
large amount of data automatically from a number of data sources. However,
ultimately, the goal of the data is to help analyze the data in light of a particular
game's logical runtime structure and processes.
Parallel Nsight Analyzer offers a simple C API called NVIDIA Tools Extension
(nvtx), which can be used to inject custom events into the capture. These developer-
defined events can help annotate the timeline view with game-specific markers and
ranges, thereby overlaying title-specific logic and structure onto the Timeline View.
You can gain access to these in your code by including
nvToolsExt.h
in your list
of header files and linking with nvToolsExt.lib.


