Game Development Reference
In-Depth Information
Figure 21.11.
System trace configuration.
per API call traced. The overhead for tracing other events is significantly smaller.
Second, high frequency events can dominate the Timeline and other reporting views,
leading to large number of irrelevant events to sort through. While the Timeline
has powerful filtering capabilities, it is often still more ecient to disable the trace
of high frequency events in favor of concentrating on the events of interest.
21.5.2 Viewing CPU, GPGPU, and Graphics Workloads
on the Timeline
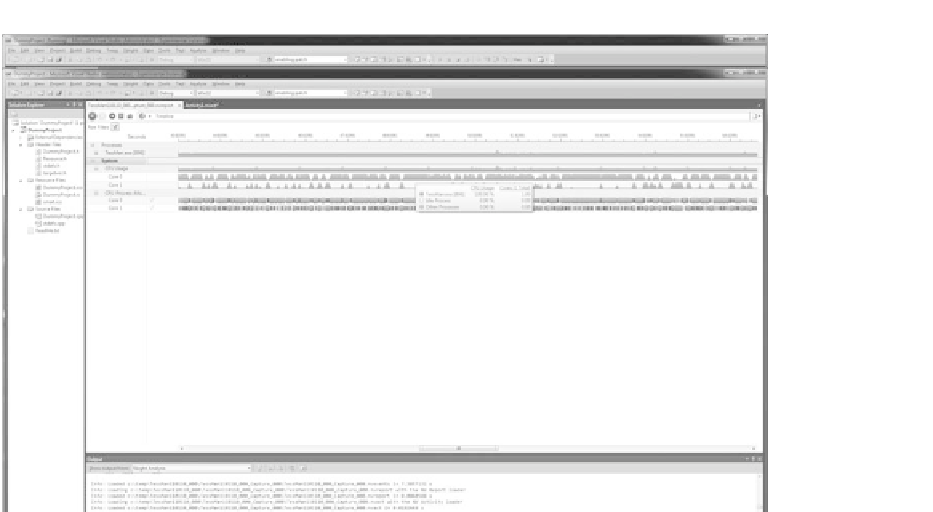
CPU utilization and core allocation.
The Timeline View displays data from your
CPU across the capture period, including utilization graphs per CPU Core, and
CPUCoreallocationevents(see
Figure21.12
)
.
The Core Allocation rows (one per CPU core) are particularly interesting, as
each interval on one of these rows represents a CPU thread that was allocated onto
the core. Threads from the game process are highlighted (in green), allowing fast
visual searching for other processes that also got allocated to a core during the
capture period.
CPU Thread state is also shown on separate thread rows underneath the process
node, with red areas indicating that the thread was in a wait state and green areas
indicating that the thread was executing normally. Games with a large number of


