Game Development Reference
In-Depth Information
WhenyouentertheDrawCallPage(see
Figure21.4
)
,youwillseeontheright-
hand side a display of the pretransform geometry submitted to the GPU. On the
left-hand side, you can see all of the bound resources, both input resources like
textures and output resources or render targets. You can use this first-level screen
to make sure the geometry looks reasonable and that the resources that are bound
are the ones you expected and are useful. For example, if the diffuse map was
incorrectly identified in a Collada file in the art pipeline, you would see it here.
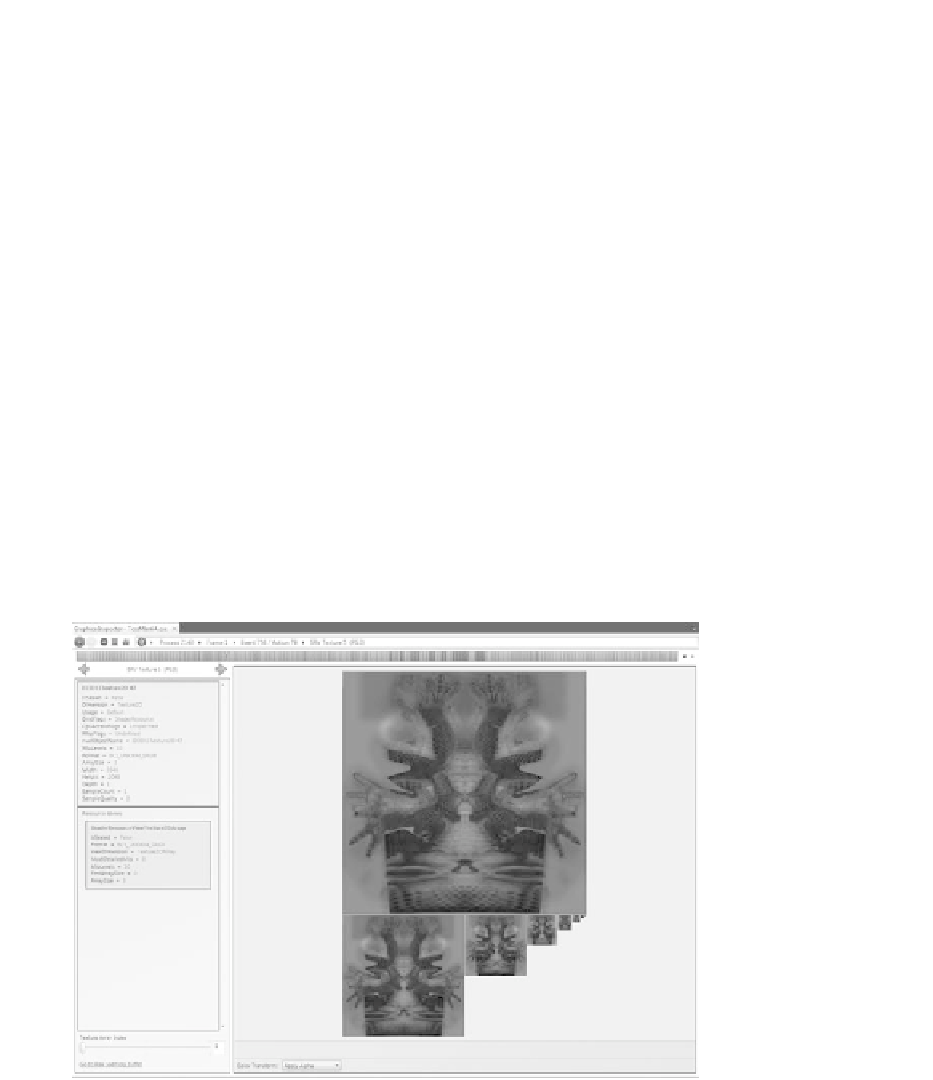
YoucanclickonthetexturestoentertheTextureInspector(see
Figure21.5
)
,
which allows you to inspect each slice of a 3D texture, face of a cubemap, and mip
level to make sure that the data is correct: maybe the texture is supposed to be
compressed but is not. Since you can see size and format information as well, these
types of bugs are easy to spot. Even the view information can be inspected to
determine, for instance, if the proper sampling method is being used. For example,
you may wonder “why is anisotropic filtering enabled for screen aligned billboards?”
That would be some wasted performance.
Another good use of the Texture Page is to debug generated textures, even
ones produced by DirectCompute calls. You can click on the resource, look at it
in the inspector, and even click the link in the lower left-hand corner to inspect
the resource as a data buffer instead of as a texture. From the data view, you can
recast the data as unsigned-integer or floating-point values, looking for values that
are incorrect.
Figure 21.5.
The Texture Page. (See Color Plate XXVIII.)