Game Development Reference
In-Depth Information
the GPU to flush all of the current work in order to make sure that all updates
have completed before kicking off the new draw calls. It is also helpful in debugging
because you can check to make sure that the correct resources are used at all stages
in rendering the scene.
Finally, something that you can do to help absorb and differentiate all of the
actions and various passes in the Frames Page is to use Direct3D performance
markers. You can use these to annotate the frame and each pass within the frame
so you can understand what each draw call in the pass does. The screenshot
in
Figure 21.3
s
hows how the performance markers are visualized under the De-
pendencies line. The API used for this functionality is
D3DPERF_BeginEvent
and
D3DPERF_EndEvent
.
21.2.4 Debugging Textures and Render Targets
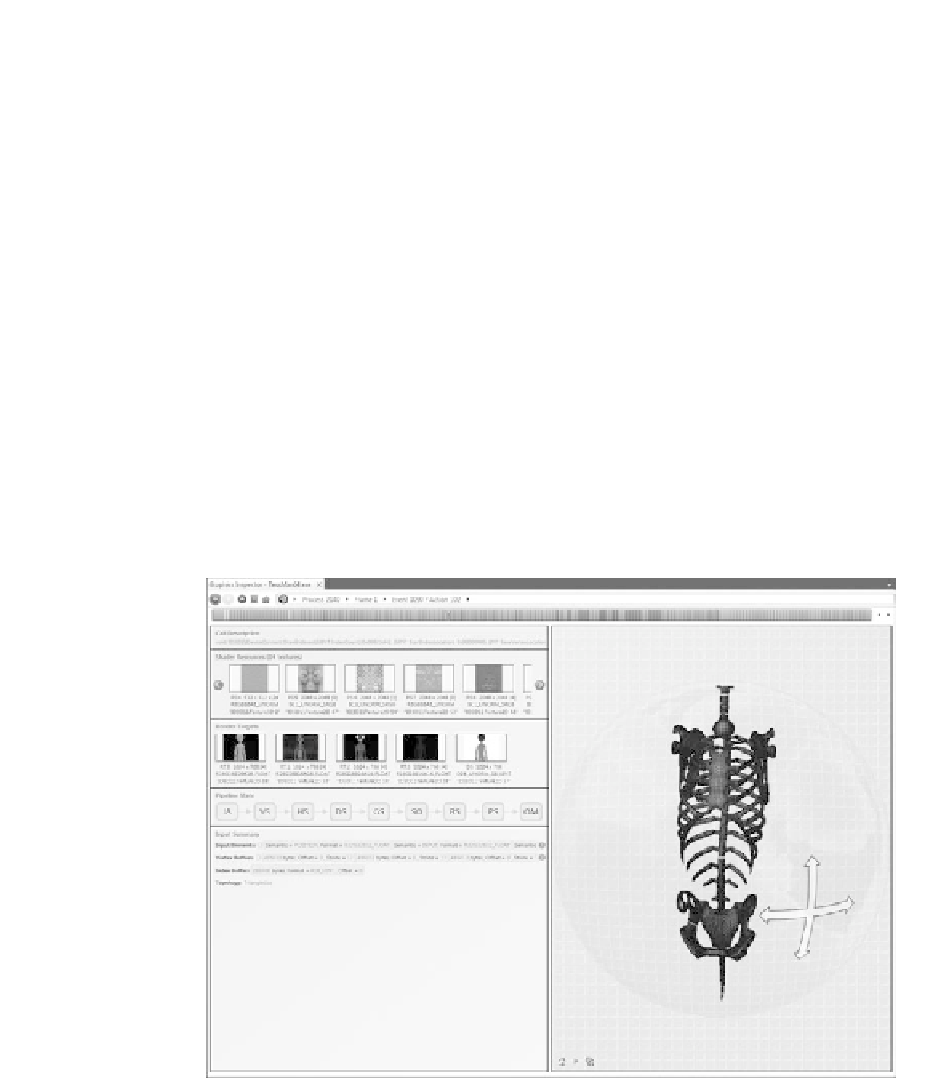
Once you find a draw call of interest, you naturally will want to inspect all of the
Direct3D setup as well as the resources used for that draw call. You can double-
click a draw call on the Frames Page, or click the link in the lower-left corner to
begin drilling down through all of that information.
Figure 21.4.
The Draw Call Page. (See Color Plate XXVII.)