Graphics Programs Reference
In-Depth Information
The other curve controls the amount of saturation, which can be edited in the
same way. However, it has little effect in this case, so you don't need it.
Figure 7.9. Clicking a point in the graph allows you to numerically edit it.
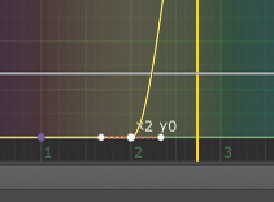
8. Double-click the X value next to the point itself. This displays an input field.
9. Change the value from 2 to 1.5, which will tell the keyer not to key out the hair.
Figure 7.10. Changing a point on a graph numerically using the input field.

Search WWH ::

Custom Search