Information Technology Reference
In-Depth Information
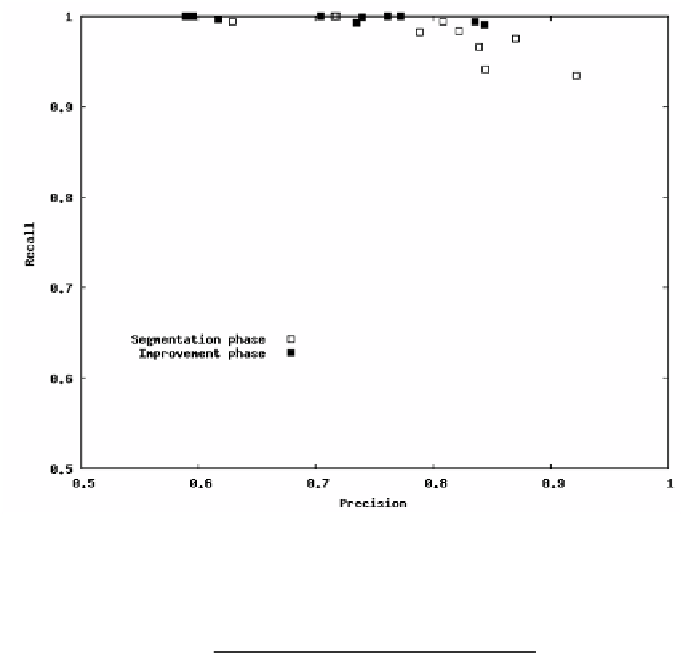
Fig. 8.
Comparison of precision and recall measures of right ventricle contours in seg-
mentation and improvement phases for 10 slices of the same heart during 1 heart cycle
le,in
in
)
n
(
M
∩ C
R
le
=
(12)
n
(
M
le,in
∩ C
in
)+
n
(
M
le,in
∩ C
ou
)
Precision indicates how many pixels inside the current contour are in fact cor-
rectly classified and recall how many pixels that are expected to be classified are
in fact inside the contour. The more both of those measures at the same time
are closer to 1, the more perfect segmentation results are. Smaller values of pre-
cision mean that contour sticks out of the mask drawn by an expert and smaller
values of recall mean that mask sticks out of the contour. Those measures are
in general not well suited for segmentation problem because they consider only
a number of pixel (contour area) and not its structure (contour shape) but for
the purposes of this article they are sucient.
The above measures were used to evaluate the segmentation phase results.
The results for 80 (8 slices and 10 phases of heart cycle) 2D images and both left
and right ventricle are presented in Fig. 4. For most of them the precision and
recall have simultaneously values above 0
8 which is a quite satisfying result.
The visual effect of segmentation phase for a sample slice is presented in Fig.
3. It seems to be quite well if the orginal image is considered (Fig. 3b). It is
quite well fitted to the image data but in comparison to the masks drawn by an
expert (Fig. 3c, Fig. 3d) it differs significantly. The reason of that is a fact that an
expert uses additional knowledge during segmentation. The improvement phase
described above focuses on one technical aspect of manual segmentation where
.