Information Technology Reference
In-Depth Information
a)
b)
c)
d)
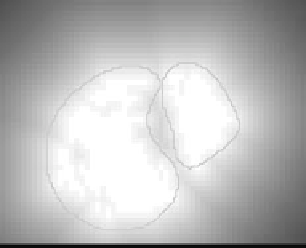
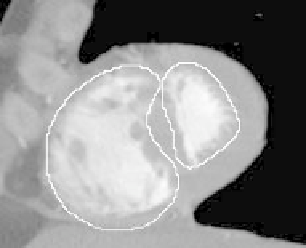
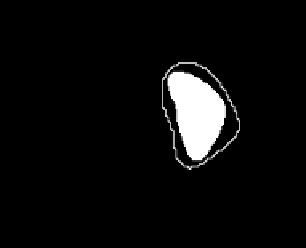
Fig. 6.
Improvement phase: (a) - potential contour of left and right ventricle (scaled
down image after thresholding with weak distance potential filter), potential contour
of left and right ventricle (original image), (c) - potential contour of right ventricle and
expert mask (
M
ri,in
- white), (d) - potential contour of left ventricle and expert mask
(
M
le,in
-white)
with injected contrast that lay on the proper side of the septum line. To put it
differently, for the right ventricle energy has the bigger value the larger contour
is, the more pixels stays at the right side of the septum line and the more pixels
above threshold stay outside the contour at the right side of that line:
+4
x
∈C
ou
∩L
le
C
in
)
n
L
ri
)
D
(
x
)
E
seg,ri
=2
n
(
+
n
(
(2)
(
I
)
n
(
I
)
n
(
C
ou
∩ L
le
)
Similarily, for the left ventricle energy has the bigger value the larger contour
is, the more pixels stays at the left side of the septum line and the more pixels
above threshold stay outside the contour at the left side of that line:
+4
x
∈C
ou
∩L
ri
E
seg,le
=2
n
(
C
in
)
n
+
n
(
L
le
)
D
(
x
)
(3)
(
I
)
n
(
I
)
n
(
C
ou
∩ L
ri
)
Here
is a slightly scaled down image after thresholding with weak distance
potential filter applied (Fig. 3a). The weights of the energy components are
chosen experimentally.
D