Information Technology Reference
In-Depth Information
a)
b)
c)
d)
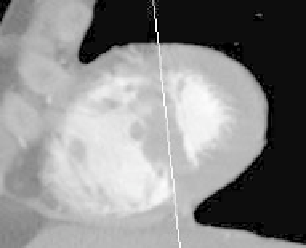
Fig. 2.
Preprocessing phase: (a) - image after thresholding, (b) - potential contour of
both ventricles (scaled down image after thresholding with weak distance potential
filter), (c) - interventricular septum line (scaled down image after thresholding with
weak distance potential filter) (d) - interventricular septum (original image)
-
C
in
,
C
ou
- set of pixels in the image that lay inside and outside the current
contour, respectively;
-
L
ri
,
L
le
- set of pixels in the image that lay on the right and left side of the
current line separating ventricels, respectively;
-
M
ri,in
,
M
ri,ou
- set of pixels in the image that lay inside and outside the
right ventricle mask drawn by an expert, respectively;
-
M
le,in
,
M
le,ou
- set of pixels in the image that lay inside and outside the left
ventricle mask drawn by an expert, respectively;
-
T
i
k
T
ou
k
- set of pixels in the image that lay inside the rectangle drawn
around the
,
k
-th contour point and lay inside and outside the current contour,
respectively.
-
n
- function that value represents the number of pixels in a given set;
-
D
- function that value represents the intensity at the given point of a
processed image (the values are in range [0
,
1]) and which definition differs
between phases;
3.1
Preprocessing Phase
The first element of the proposed top-down detection process is localisation of
both heart ventricles. In this phase potential active contours are used. At this