Information Technology Reference
In-Depth Information
Acc
aa
Acc
al
100
100
80
80
60
60
40
40
20
20
0
0
m
12345m
1234567891
Acc
av
Acc
aw
100
100
80
80
60
60
40
40
20
20
0
0
m
123456m
135791113
Acc
ay
100
80
60
40
20
0
123456m
Fig. 3.
Plotted results of accuracy against
m
for each subject, testing on BCI competition III;
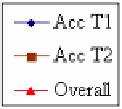
dataset IVa. Acc T1 is the percentage of correctly classifying Task 1. Acc T2 is defined simi-
larly. Dashed line represents the selected
m
using automatic approach, while dashed-dotted line
represents the selected
m
using semi-automatic approach. If both approaches agree on
m
, only
one dashed line is used for representation.
6 Discussion
For dataset from BCI competition IV; dataset 1, subject
a
showed that both of our
selection approaches gave the same values of
m
. Two out of three of binary classifica-
tions, Task1 vs. Task2 and Task1 vs. Relax, showed validity of our approaches. For
the Task2 vs. Relax, CSP fails to provide suitable features. Regardless of the value of
m
, either one of two classes was classified with accuracy below a pure chance (50%).
For subject
b
, our both selection approaches also gave the same values for all pairs,
and the results are satisfied. The given parameters gave the overall accuracy on posi-
tion that beginning to stop increasing when
m
is increased. For subject
f
, on Task1 vs.
Task2, the automatic approach output
m
= 2. This value yields a high overall accuracy


