Information Technology Reference
In-Depth Information
100
100
100
80
80
80
60
60
60
a
40
40
40
20
20
20
0
0
0
1
2
3
4
10 15 20 24 25
1 234 56
12345678
100
100
100
80
80
80
60
60
60
b
40
40
40
20
20
20
0
0
0
1234
123456
123456
100
100
100
80
80
80
60
60
60
f
40
40
40
20
20
20
0
0
0
123 456
123456
12345
100
100
100
80
80
80
60
60
60
g
40
40
40
20
20
20
0
0
0
1 234 56
12345678
12356791011
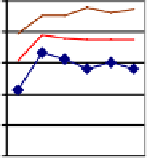
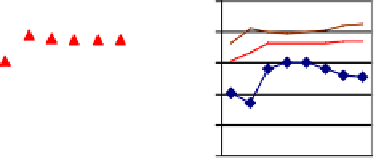
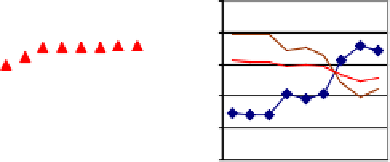
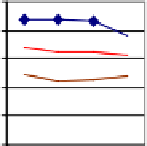
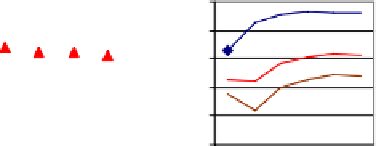
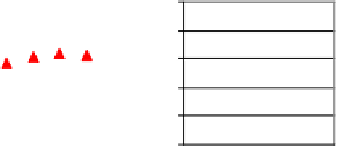
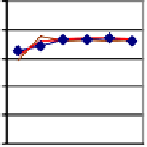
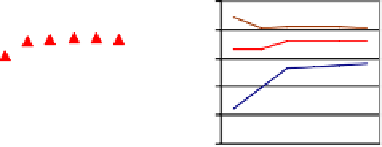
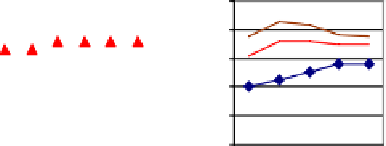
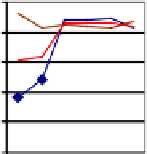
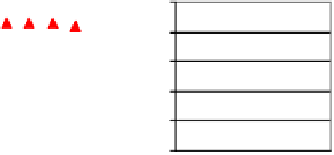
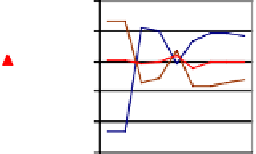
Fig. 2.
Plotted results of the accuracy against
m
for each subject, testing on BCI competition
IV; dataset 1. Here, y-axis is accuracy (%) and x-axis is
m
. Acc T1 is the percentage of cor-
rectly classifying Task 1. Acc T2 and Acc R are defined similarly. Dashed line represents the
selected
m
using automatic approach, while dashed-dotted line represents the selected
m
using
semi-automatic approach. If both approaches agrees on
m
, only one dashed line is shown. Each
column shows results of the classification between a pair of tasks.