Information Technology Reference
In-Depth Information
In the present study, voxels in several predefined regions are selected as fea-
tures according to ACT-R (Adaptive Control of Thought-Rational) theory [15,
16]. As a cognitive architecture, ACT-R assumes that cognition emerges through
the interaction of a set of modules, 8 brain regions are mapped to these specific
modules. In this study, voxels in 5 bilateral brain regions that are related to the
sudoku solving are selected to build our model. The 5 bilateral brain regions
are as followed: lateral inferior prefrontal cortex (PFC) , centered at Talairach
coordinates x =
40, y = 21, z = 21, reflect retrieval of information in declar-
ative module; posterior parietal cortex (PPC) , centered at x =
±
23, y = -64,
z = 34, reflect changes to problem representations in imaginal module; anterior
cingulate cortex (ACC), centered at x =
±
5, y = 10, z = 38, control various
stages of processing and prevent the problem solving state from distracting from
the goal; caudate, centered at x =
±
15, y = 9, z = 2, play an action-selection
role; and fusiform gyrus (FG), centered at x =
±
42, y = -60, z = -8, engage
in visual processing [14, 15, 16]. 748 voxels in these predefined regions were se-
lected including bilateral PFC (5
±
×
5
×
4, i.e., 5 voxels wide, 5 voxels long, and
4 voxels high), bilateral PPC region (5
×
5
×
4), bilateral FG region (5
×
5
×
3), bilateral ACC region (3
×
5
×
4), bilateral caudate region (4
×
4
×
4).
Feature (Value) Extraction
How to extract feature values to build classifier's input vectors is also a key factor
to affect the performance of classification. According to hemodynamic response
function, the BOLD signal changes by cognition increases to arrive at the peak
values after 4-8 seconds from the cognitive stimuli, then decreases gradually, and
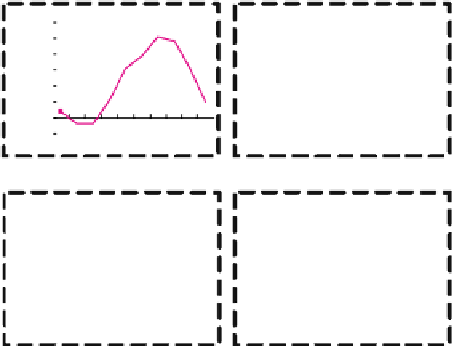
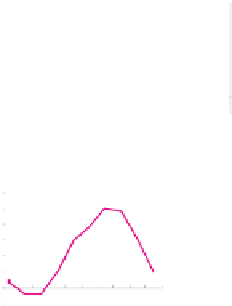
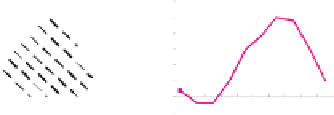
the BOLD signal lasts about 12-14 seconds. So how to abstract the characteristic
of BOLD signal change is very important. In general, as depicted in Figure 3,
0.6
0.6
0.5
0.5
0.4
0.4
0.3
0.3
0.2
0.2
0.1
0.1
a
0
0
-
0.1
-0.1
-2 -1
0
1
2
3
4
5
6
7
-2-1012 34 567
(a) Peak value
(b) Change Rate
0.6
0.6
0.5
0.5
0.4
0.4
0.3
0.3
0.2
0.2
0.1
0.1
0
0
-2-1012 34 567
-2 -1 0 1
2 3 4
5
6 7
-0.1
-0.1
(c) Cumulate changes
(d) Each point value change
Fig. 3.
Features used to describe BOLD effect