Information Technology Reference
In-Depth Information
Figure 14. Application visible I/O delays on 100MB interleaved reads
puts decrease to 12.29MB/s and 35.30MB/s, in
which the demand readahead is 2.87 times fast.
When it comes to hundreds of concurrent clients,
which is commonplace for production file serv-
ers, it effectively renders the in-disk readahead
useless. So figure 13(a) may be a more realistic
measurement of the readahead performance at
high concurrency.
Figure 14 plots the total application visible I/O
delays in each benchmark. When the number of
streams increases, the legacy readahead delays
increase rapidly from 3.36s for single stream
to 122.35s for 10 streams, while the demand
readahead delays increase slowly from 2.89s to
3.44s. There is a huge gap of 35.56 times for the
10 streams case. This stems from the fact that the
legacy readahead windows can hardly ramp up
to the ideal size, leading to smaller I/O and more
seeks, increasing the total disk I/O latencies. Be-
cause the async readahead size will also be reset
and limited to small values, it can hardly hide I/O
latencies to the upper layer.
readahead thrashing
We boot the kernel with mem=128m single, and
start one new 100KB/s stream on every second.
Various statistics are collected and showed in
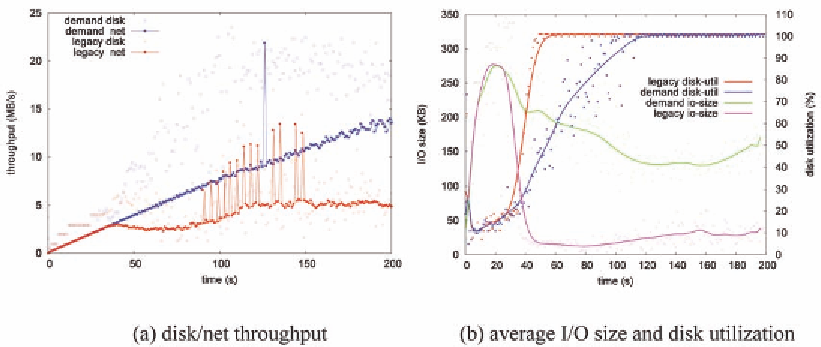
figure 15. The thrashing begins at 20 second. The
legacy readahead starts to overload the disk at 50
second, and eventually achieved 5MB/s maximum
network throughput. With the new framework,
Figure 15. I/O performance on readahead thrashing

Search WWH ::

Custom Search