Information Technology Reference
In-Depth Information
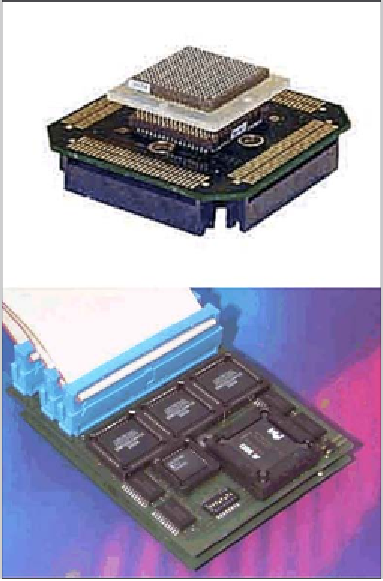
Figure 12. Example ICE adapter and ICE module
on each read and write of memory in the
defined range. Depending on the type of
DTM message, a timestamp, the data value
read/written, the address of memory access,
the current mapped page, and a control flow
association are included.
•
Runtime system memory substitution via
memory substitution messaging (MSM),
which has the ability to substitute portions
of memory with new code passed from the
debugging host via the Nexus interface.
Triggers for substitution are exit, reset, and
watchpoints.
•
Signal watchpoint and breakpoint events,
which are used to indicate that specific
instruction addresses or data addresses (con-
ditional) have been accessed. Watchpoints
are a variation of breakpoints that do not halt
the target processor. Both watchpoints and
breakpoints can be set to operating system
and runtime library functions of interest,
such as thread control and synchroniza-
tion.
Nexus and JTAG-compatible devices can
be chained together and read from the same
debugging host, which is particularly useful for
SMP and multi-core environments, where the
profiling needs to collate events from dif ferent
processors.
On-chip debugging interfaces and ICE solu-
tions provide a primitive means for extracting low-
level behavior of a program. They are particularly
useful at collecting “raw” low-level details of ex-
ecution, such as control flow and memory activity,
that in turn can be used to assure absence of race
conditions, deadlock, and so forth. For example,
the following approach might be used to ensure
that a program is free of race-conditions:
virtual addressing or address translation,
moreover, an OTM is also transmitted
periodically during runtime at a minimum
frequency of every 256 Program/Trace mes-
sages.
•
Program trace via branch trace messaging
(BTM), where messages are triggered for
each change in pro gram flow discontinuity
as a result of either a branch decision or an
exception. Control flow can be corre lated to
program code, where the code is static. BTM
messages include timestamp information
and the full target-branch address. Thread/
task ownership can be correlated from the
last received OTM message.
•
Data trace messaging (DTM), where a mini-
mum of two trace windows define the start
and end memory addresses that should be
monitored. DTM messages are dispatched
•
Identify address ranges for memory that are
shared across one or more threads.
•
Identify addresses for synchronization locks
and/or functions.
Search WWH ::

Custom Search