Information Technology Reference
In-Depth Information
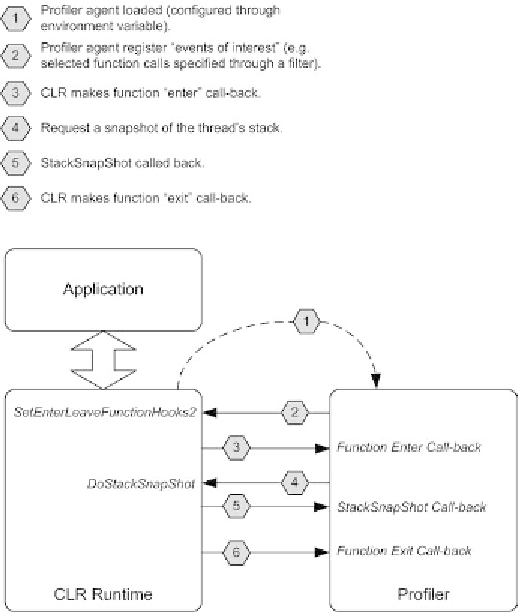
Figure 11. Messaging sequence of CLR profiling
fully qualified method name and also the call's
parent, that is, the method from which the method
being traced was called.
Inspecting the stack to determine parental
methods (and ultimately the call-chain) is a useful
t e c h n i q u e f o r d i s a m b i g u a t i n g s y s t e m c a l l s . F o r e x -
ample, this approach can be used to disambiguate
different lock calls so that per-lock information
(e.g., hold and wait times) can be correlated with
different call sites in the source code.
through JVMTI functions, such as
Agent _ On-
Load()
and
Agent _ OnUnload()
, which
are exported by the agent. The JVM supplies a
pointer, via the
Agent _ Onload()
call, that
the agent can use to get an instance of the JVMTI
environment. The agent can then use this pointer
to access JVMTI features, such as reading the
state of a thread, stopping/interrupting threads,
obtaining a stack trace of a thread, or reading
local variable information. The agent uses the
SetEventCallbacks()
method to pass a
set of function pointers for different events it is
interested. When events occur, the corresponding
function is called by the JVM, which allows the
agent to record the state of the application.
Although the CLR and JVMTI profilers share
many common features, such as events related to
methods or threads and stack tracing ability, there
JVMTI Proiler
The JVMTI (Sun Microsystems Corporation,
2004) is similar to the CLR Profiler Interface in
that it requires a plug-in, which is implemented
as a dynamic link library using a native language
that supports C. The JVM interacts with the agent
Search WWH ::

Custom Search