Graphics Reference
In-Depth Information
1
0.8
0.6
0.4
0.2
0.5
1
1.5
2
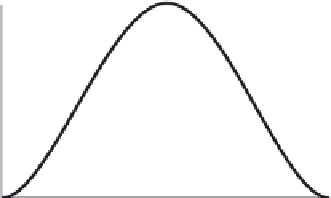
Default tension,
t
0
1
1
0.8
0.8
0.6
0.6
0.4
0.4
0.2
0.2
0.5
1
1.5
2
0.5
1
1.5
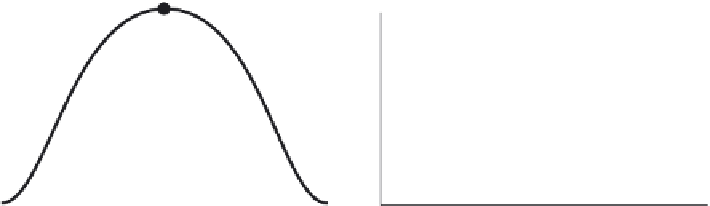
Low tension,
t
3/4
High tension,
t
3/4
FIGURE B.47
The effect of varying the tension parameter.
The three parameters, tension, continuity, and bias, are combined in
Equation B.88
.
ð
ð
1
t
Þ
ð
1
þ c
Þ
ð
1
þ b
Þ
Þ
ð
ð
1
t
Þ
ð
1
c
Þ
ð
1
b
Þ
Þ
T
i
¼
ð
P
i
P
i
1
Þ þ
ð
P
iþ
1
P
i
Þ
2
2
(B.88)
ð
ð
1
t
Þ
ð
1
c
Þ
ð
1
þ b
Þ
Þ
ð
ð
1
t
Þ
ð
1
þ c
Þ
ð
1
b
Þ
Þ
T
i
¼
ð
P
i
P
i
1
Þ þ
ð
P
iþ
1
P
i
Þ
2
2
B.5.12
B-splines
B-splines are the most flexible and useful type of curve, but they are also more difficult to grasp intu-
itively. The formulation includes Bezier curves as a special case. The formulation for B-spline curves
decouples the number of control points from the degree of the resulting polynomial. It accomplishes
this with additional information contained in the
knot vector
. An example of a
uniform knot vector
is
[0,1,2,3,4,5,6,...,
n þ k
1], in which the knot values are uniformly spaced apart. In this knot
vector,
n
is the number of control points and
k
is the degree of the B-spline curve. The parametric value


Search WWH ::

Custom Search