Environmental Engineering Reference
In-Depth Information
and C showed the SO
2
concentration in simulated flue gas in ppm. The HCl con-
centration was adjusted to 50 ppm based on standard gas. The experiment results on
the influence of simulated flue gas components on Hg
0
adsorption by AC(XK) are
shown in Fig. 5.27.
Axis A:
%
A
x
is
B
: p
p
m,
C
: ppm
1800
18
CO
2
(A:%)
O
2
(A:%)
NO (B:ppm)
NO
2
(B:ppm)
SO
2
(C:ppm)
300
1600
15
1400
250
1200
12
200
1000
9
150
800
600
6
100
400
3
50
200
0
0
0:33:10 1:06:30 1:39:50 2:13:10 2:46:30 3:19:50 3:53:10 4:26:30 4:59:50 5:33:10 6:06:30 6:39:50
Time (h:m:s)
Fig. 5.26
Main concentrations of simulated flue gas components at the outlet of the adsorption bed
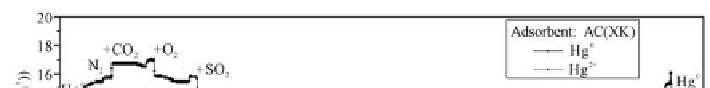
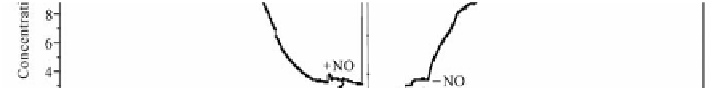
Fig. 5.27
Influence of simulated flue gas components on Hg
0
adsorption by AC(XK)
The experiment on the influence of simulated flue gas components on Hg
0
ad-
sorption by AC(XK) was divided into two parts. First, simulated flue gas compo-
nents were added one by one (from CO
2
to HCl), and second, simulated flue gas
components were subtracted one by one (from NO
2
to CO
2
).
As shown in Fig. 5.27, CO
2
and O
2
did not affect Hg
0
adsorption by AC(XK)
when they were added. When SO
2
was added, the concentrations of CO
2
and O
2
decreased slightly. Here, SO
2
may have promoted adsorption of O
2
and CO
2
on AC.
With the combined action of O
2
, CO
2
and SO
2
, Hg
0
adsorption by AC(XK) was
promoted, Meanwhile, Hg
2+
exhibited a small peak, which indicated that Hg
2+
was
formed during the process of Hg
0
adsorption by AC(XK).


Search WWH ::

Custom Search