Biology Reference
In-Depth Information
11.4 Comparison of the Dose-Dependent Effects of 2-APB
and U73122 on [Ca
2+
]i and eNOS Activity
Having established that U73122 (an inhibitor of phospholipase C, so blocking IP3
generation) and 2-APB (blocking IP3 action) could completely block the elevation
of [Ca
2+
]i in NP- and P-UAEC, it followed that a comparison of the dose depen-
dency of the effects of 2-APB and U73122 on initial and sustained phase [Ca
2+
]i
alongside a parallel comparison of eNOS activation may prove useful to establish
more clearly the causal relationship between the two events. Given that previous
imaging of [Ca
2+
]i in UAEC had often been performed at low cell density, but
eNOS activity was also assessed by arginine-citrulline conversion assay in UAEC at
70-80% confluency, [Ca
2+
]i imaging was performed using cells at the same density.
Since the activity assay measures the total of all the cells in a dish, [Ca
2+
]i imaging
was also performed using full field measurement, i.e. recording the average [Ca
2+
]i
of many cells, rather than imaging of single cells. As such the initial maximum
was measured as the peak of the initial spike, and the sustained phase [Ca
2+
]i level
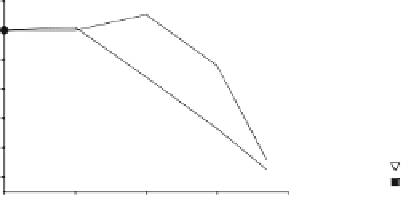
was measured as the maximum plateau value achieved thereafter [30]. Figure 11.2
illustrates the effect of 2-APB in NP- and P-UAEC. The data shows one striking
feature, that in all cases the decline in eNOS activity in the presence of antagonist
only occurred at higher doses than the decline in [Ca
2+
]i, regardless of whether we
are referring to [Ca
2+
]i peak or plateau. This suggests that while [Ca
2+
]i may play a
role in eNOS activation, it may not be the sole regulator. This finding is consistent
with other work on kinase regulation of UAEC eNOS activation, and similar obser-
vations have also been made in freshly isolated UA endothelium by DAF imaging
[36], namely that 2-APB will fully block ATP-stimulated elevation of [Ca
2+
]i in
freshly isolated P-UA endothelium but not fully block corresponding increases in
2-APB in NP-UAEC
2-APB in P-UAEC
120
120
100
100
*
80
80
60
60
*
*
40
40
*
*
20
Peak Ca2+
eNOS Activity
*
20
Peak Ca2+
Plateau Ca2+
eNOS Activity
*
*
0
0
*
*
*
0
0.1
1
10
100
0
0.1
1
10
100
[2-APB] (
μ
M)
[2-APB] (
μ
M)
Fig. 11.2
Concentration-dependency of 2-APB inhibition of Ca
2+
and NO production in UAEC.
The effect of 2-APB on the peak [Ca
2+
]i, maximum of the sustained phase [Ca
2+
]i and the eNOS
activity as measured by arginine-citrulline conversion are shown. P and NP-UAEC were treated
with ATP (100
μ
M) for 10 min with or without 5 min pretreatment with indicated concentrations
of 2-APB. Data are normalized for the different assays by expression as % of ATP response alone
(
n
=
SE. (
∗
P
< 0.05 relative to ATP control response). Figure is
4-6). Values shown are mean
±
modified from that published in [30]


Search WWH ::

Custom Search