Biology Reference
In-Depth Information
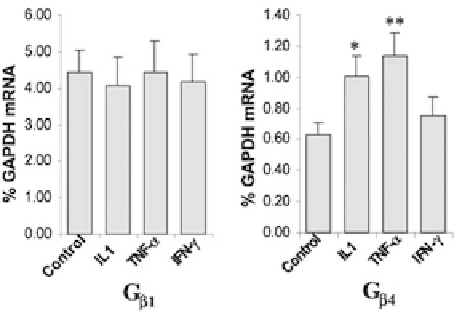
Fig. 6.2
Effect of inflammatory cytokines on the expression of G
β
1
and G
β
4
proteins in HMVEC.
Cells were treated overnight with IL-1, TNF-
, followed by mRNA and protein analyses.
Quantitative real-time PCR was performed to estimate the copy number of cDNA for G
β
1
and G
β
4
proteins, and data are expressed as the percentage of GAPDH cDNA. Data shown are the mean
(
α
,orIFN-
γ
SEM) of four independent experiments.
∗
p
< 0.05;
∗∗
p
< 0.01. Reproduced from [42] with
permission.
±
Fig. 6.3
TNF-
differential modulation of the stimulatory effect of the adenosine
receptor agonist CGS-2168 on VEGF mRNA expression. HMVECs were pretreated overnight
with TNF-
α
and IFN-
γ
α
or IFN-
γ
, then stimulated with CGS-21680 (1
μ
M) for 4 h in the absence (CGS)
or the presence of 1
M ZM-241385 (CGS + ZM). The expression of VEGF message was quan-
titated by real-time PCR and is presented as a percentage of the control (none). The basal levels
of VEGF in unstimulated cells (without agonist or antagonist) were 1.55
μ
±
0.30, 2.02
±
0.59, and
1.62
±
0.12% of GAPDH mRNA for control, TNF-
α
-treated, and IFN-
γ
-treated cells, respectively
(
n
=
3). Reproduced from [42] with permission

Search WWH ::

Custom Search