Environmental Engineering Reference
In-Depth Information
ʱ
-pinene and
ʲ
-pinene, and limonene, with the highest concentrations reached by
sabinene. An almost homogeneous vertical distribution was observed, instead, for
benzene and toluene indicating that no substantial sources for these components
existed over the site during these measurements. Data collected on the other days
indicated, however, that daily fluxes of
ʱ
-pinene and
ʲ
-pinene did not always cor-
relate with those of sabinene, suggesting that other sources than local vegetation
contributed to them. In particular night-time trapping of air masses advected from
the valleys seemed to simulate well early morning emission. In other cases real
emission of these monoterpenes occurred because of biomass burning in picnic
fires. In the latter case, high fluxes of
ʱ
-pinene and
ʲ
-pinene were accompanied by
high fluxes of pyrogenic VOC. Although sabinene is a very photochemically reac-
tive compound (Atkinson and Arey
2003
), the turbulent mixing was high enough
during sampling to minimize the loss due to reactivity. Severe losses accompanied
by strong dilution were indeed observed at an altitude higher than 160 m, where
polluted air masses advected from the valleys were mixed with forest emission.
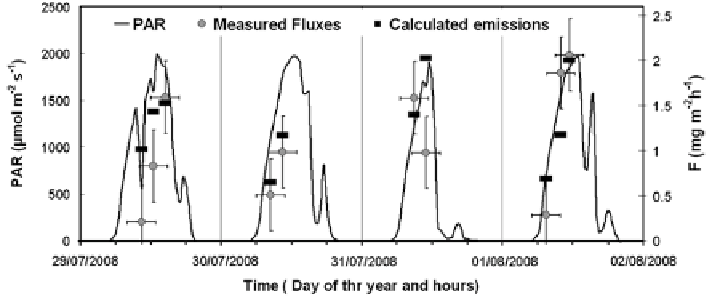
By using the concentrations measured with the balloon and the meteorological
parameters recorded at the tower, sabinene fluxes were calculated from Eq.
3.2
and compared with the values predicted by the model and with the PAR profile
measured at the tower (Fig.
3.5
). Data show that measured fluxes of sabinene did
not substantially differ from the emission values predicted by the model. Both
are fully consistent with the large dominance of
F. sylvatica
over the site and the
T
+
L dependence of its emission (Dindorf et al.
2006
). Although both data follow
the trend of PAR, some differences exceeding the experimental error are seen in
some instances. Since the tower was located 1 km away from the site, we expected
such differences to occur whenever meteorological parameters measured at the
tower were not exactly the same as those existing over the area where the balloon
was raised. This happened when clouds were covering the tower but not the val-
ley. As it can be seen from the PAR profile of Fig.
3.5
, the passage of clouds was
quite frequent and never was a perfect Gaussian shape centered at noon achieved.
Fig. 3.5
Daily sabinene fluxes measured with the gradient method compared with the sabinene
emission predicted by the model and the PAR measured at the tower