Environmental Engineering Reference
In-Depth Information
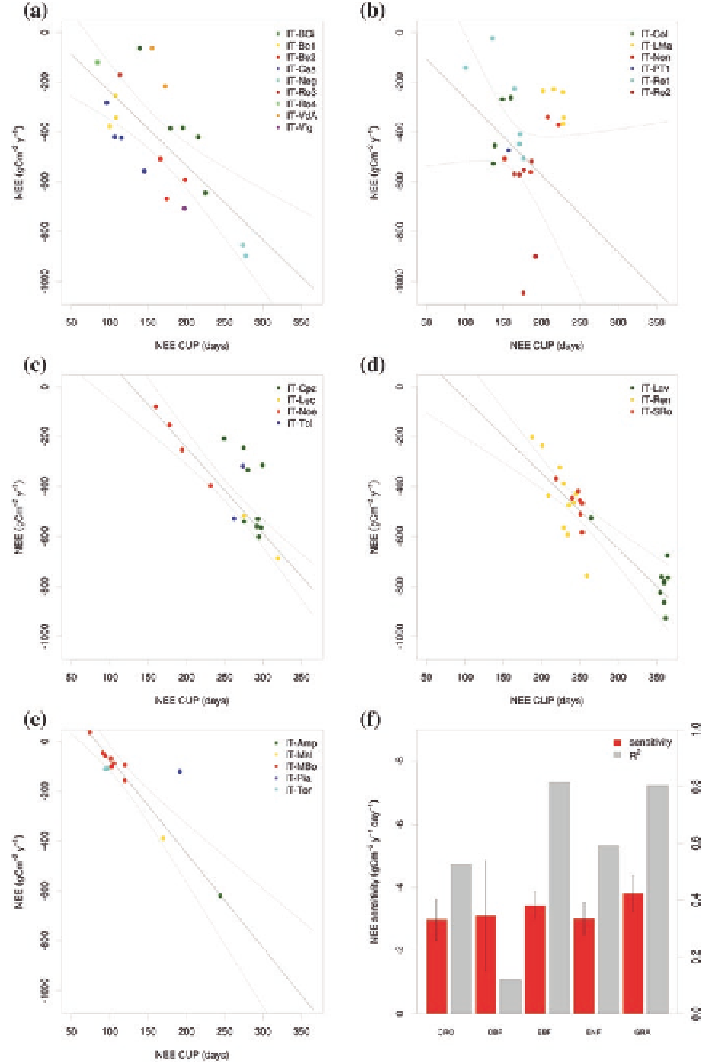
Fig. 2.5
Linear regression analysis between NEE annual values and CUP for each PFT. Panel
f
presents the sensitivity (
red bars
with s.e.) and R
2
(
grey bars
) of the relation between NEE and
CUP for each PFT