Environmental Engineering Reference
In-Depth Information
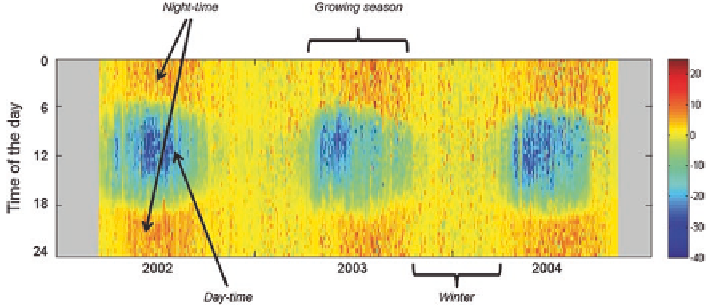
Fig. 2.2
Example of fingerprint plot to visualize Eddy Covariance time series. The
colors
are
instantaneous (half hour) CO
2
fluxes in µmol CO
2
m
−
1
(site IT-PT1). It is possible to see
clearly the seasonal dynamic with emissions of CO
2
during winter when only respiration is pre-
sent and the diurnal cycle with CO
2
assimilation in the daytime. The minor CO
2
uptake in the
summer of 2003 is to be noted, as a consequence of the European heat wave (Ciais et al.
2005
)
−
2
s
general as g C m
−
2
day
−
1
. By convention, negative values are fluxes going from
the atmosphere to the ecosystem (carbon sink).
One of the best ways in order to have a graphical overview of the measure-
ments is the “fingerprint” plot (Fig.
2.2
): it is an image where on the X axis there
are the days, on the Y axis the hours and the color indicate the flux magnitude and
sign. Using this type of plot it is possible to easily follow and analyze the diurnal,
seasonal and inter annual patterns and identify anomalies.
The Fig.
2.3
shows the comparison of two cropland sites (IT-BCi cultivated
with maize all the years and IT-Be2 cultivated with alfalfa in 2007-2009 and
maize in 2010) and it is possible to see the effect of the management options: till-
age before the carbon uptake period (CUP) in IT-BCi, the four harvest in 2007-
2009 in IT-Be2 and the difference in the magnitude of the uptake, with the maize
reaching higher values (C4 photosynthesis) in IT-BCi and also in IT-Be2 in 2010
(see Sect.
2.2.2
). In the same figure a grassland site with a long time series of data
is also reported (IT-MBo) and it is possible to identify the differences in the sea-
sonal cycle with a winter basically without activities because of the snow and cold
temperature.
Another interesting example is given by the comparison of the two oak coppice
forests in central Italy (Fig.
2.4
). The two sites are in two compartments with dif-
ferent ages with IT-Ro1 monitoring a forest just after the harvesting occurred in
2000 and IT-Ro2 in an older forest now ready to be harvested. It is interesting to
note that the fluxes are higher in the mature forest but also the young stand recov-
ered quite rapidly a good photosynthesis capacity. In addition in both the stands
it is possible to see the effect of the heat-wave in 2003 (Ciais et al.
2005
) with a
strong reduction of the carbon assimilation in summer and a similar anomaly also
in 2008.